The US BizAv (Business Aviation) market has been booming since March 2021. This series of articles track the traffic trend of this market. We define the BizAv market as part-135 on-demand for-hire private flying by business jets or certain turboprop planes. The numbers in the following charts exclude part-91 private flights. If you are interested in all flights by business jets, or detailed flights by route and operator, please get in touch with us.
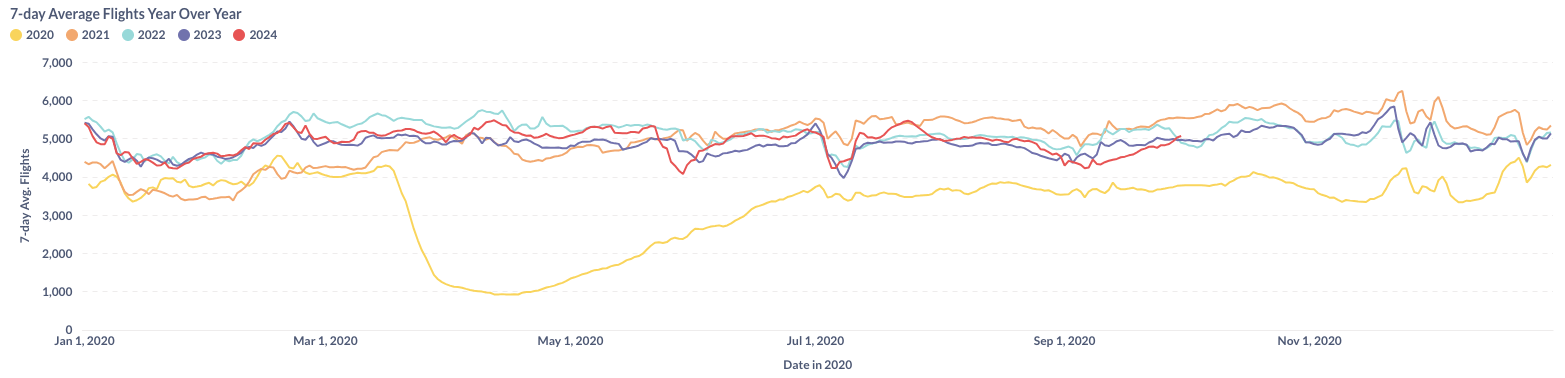
Figure 1: Year over Year Trend of the U.S. BizAv Market
Figure 1 illustrates the trends in U.S. Business Aviation (BizAv) traffic from January 2020 to September 2024. In early September 2024, business flight activity in the U.S. fell to levels below those recorded in the previous two years. However, by the end of the month, the activity had recovered.
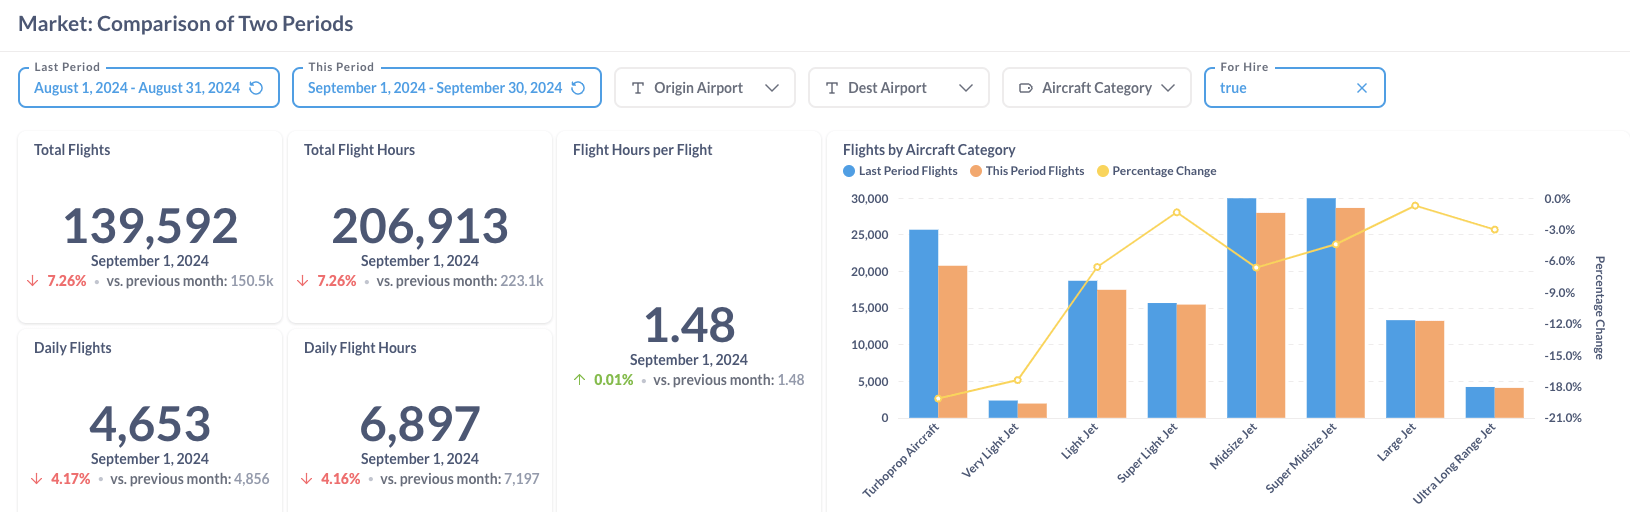
Figure 2: Comparison of the U.S. BizAv Flights This Month vs. Last Month
Figure 2 presents a comparative analysis of flight data for August and September 2024, showing a 4.17% reduction in daily flight frequency. The average flight hours per flight remained nearly unchanged, resulting in a 4.16% decrease in overall daily flight hours. Although flight activity declined across all aircraft categories in September, the decrease was more pronounced in Turboprops and Very Light Jets compared to Super Light Jets and Large Jets.
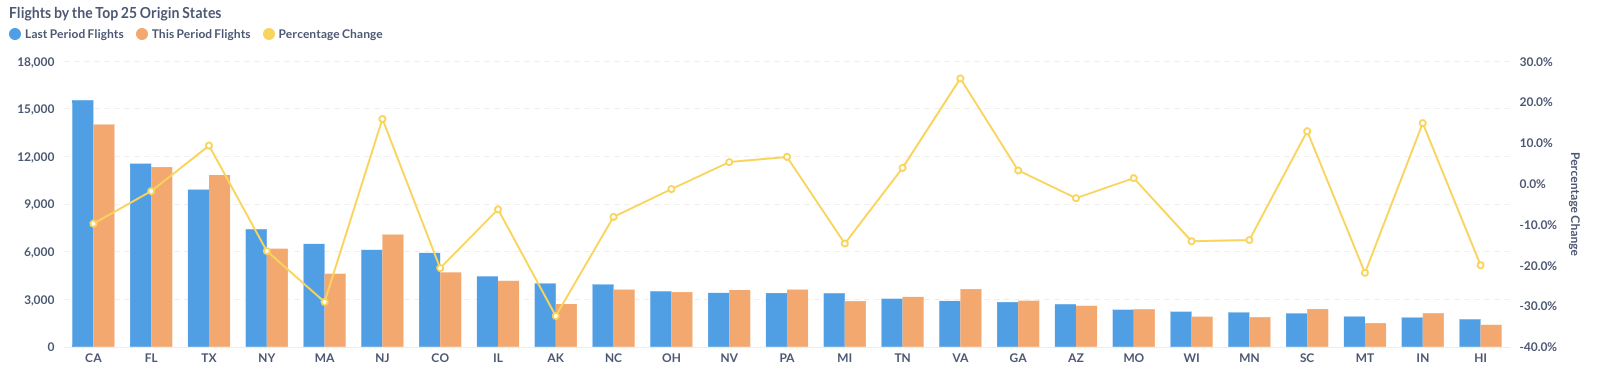
Figure 3: Comparison of the U.S. BizAv Flights by the Top 25 Origin States (This Month vs. Last Month)
In August and September 2024, business aviation activity fluctuated across U.S. states. California saw a 9.8% decline, while Florida experienced a 9.3% increase. Virginia recorded the highest growth among the top states at 25.7%, whereas Alaska faced the steepest drop, with a 32.5% decrease.
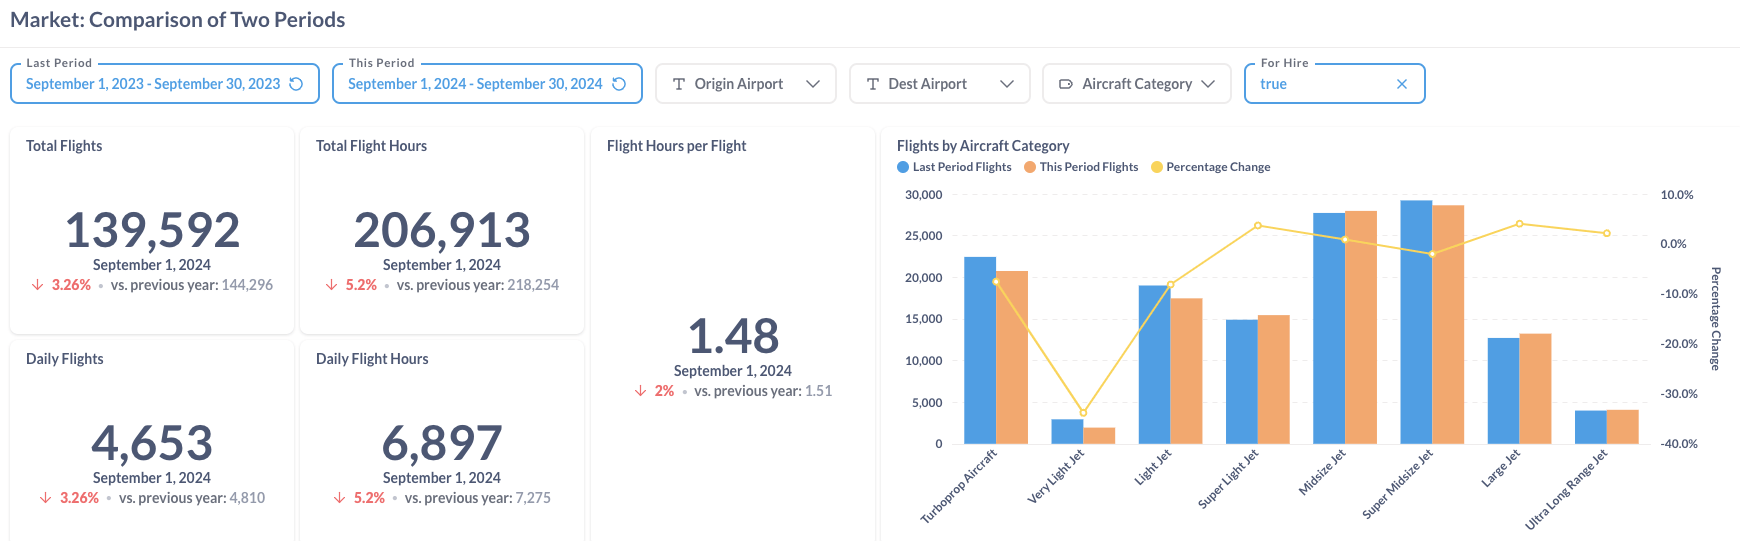
Figure 4: Comparison of the U.S. BizAv Flights This Year vs. Last Year
In September 2024, the number of flights decreased by 3.26%, and daily flight hours dropped by 5.2% compared to September 2023, primarily due to a 2% reduction in average flight hours per flight. Very Light Jet activity saw a sharp decline of 33.8%, while larger aircraft, from Super Light Jets to Ultra Long Range Jets, experienced relatively smaller changes.
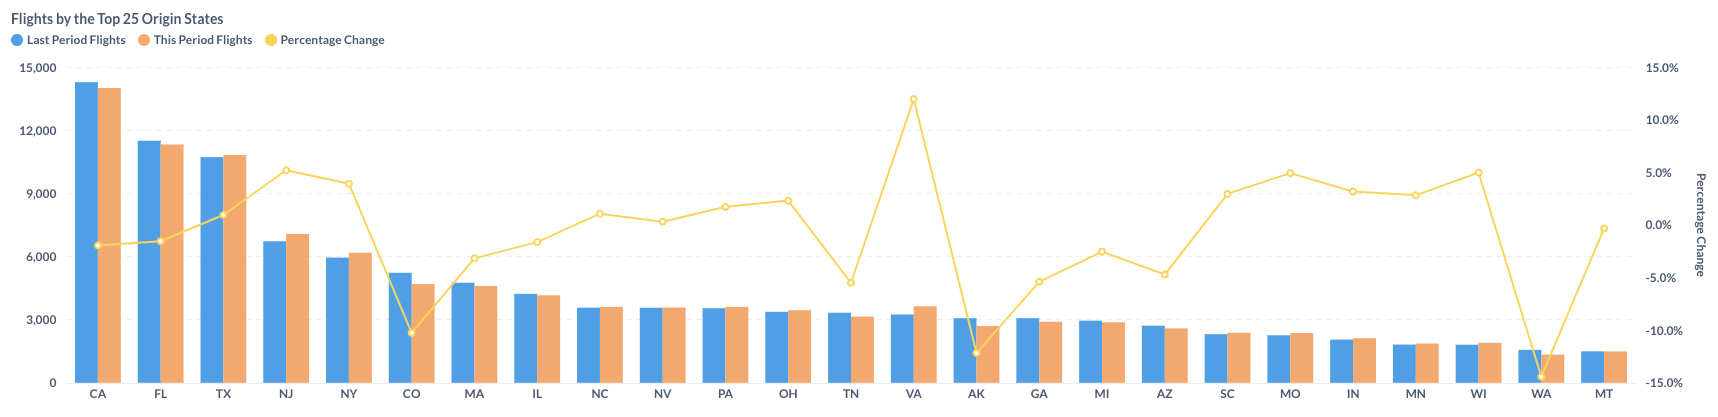
Figure 5: Comparison of the U.S. BizAv Flights by the Top 25 Origin States (This Year vs. Last Year)
When comparing flight data from September 2023 to September 2024, some states, such as Colorado and Alaska, experienced significant declines in total flight activity, while others, including Virginia and New Jersey, saw increases.