The US BizAv (Business Aviation) market has been booming since March 2021. This series of articles track the traffic trend of this market. We define the BizAv market as part-135 on-demand for-hire private flying by business jets or certain turboprop planes. The numbers in the following charts exclude part-91 private flights. If you are interested in all flights by business jets, or detailed flights by route and operator, please get in touch with us.
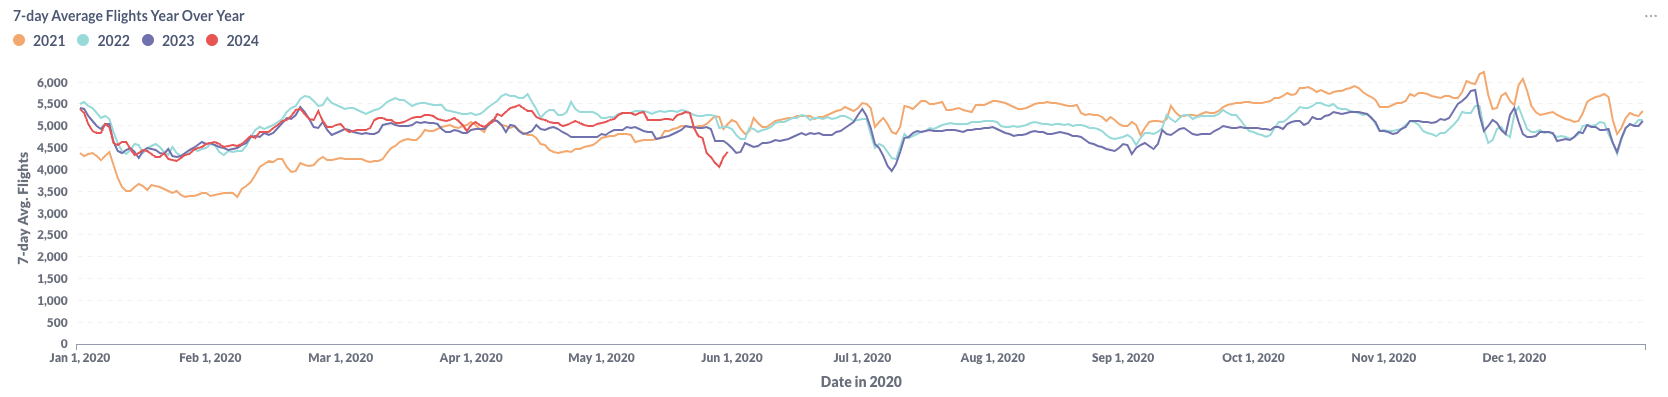
Figure 1: Year over Year Trend of the U.S. BizAv Market
Figure 1 illustrates the trends in U.S. Business Aviation (BizAv) traffic from January 2021 through May 2024. In May 2024, there was a notable decline in flight activities in the US, followed by a rebound towards the end of the month.
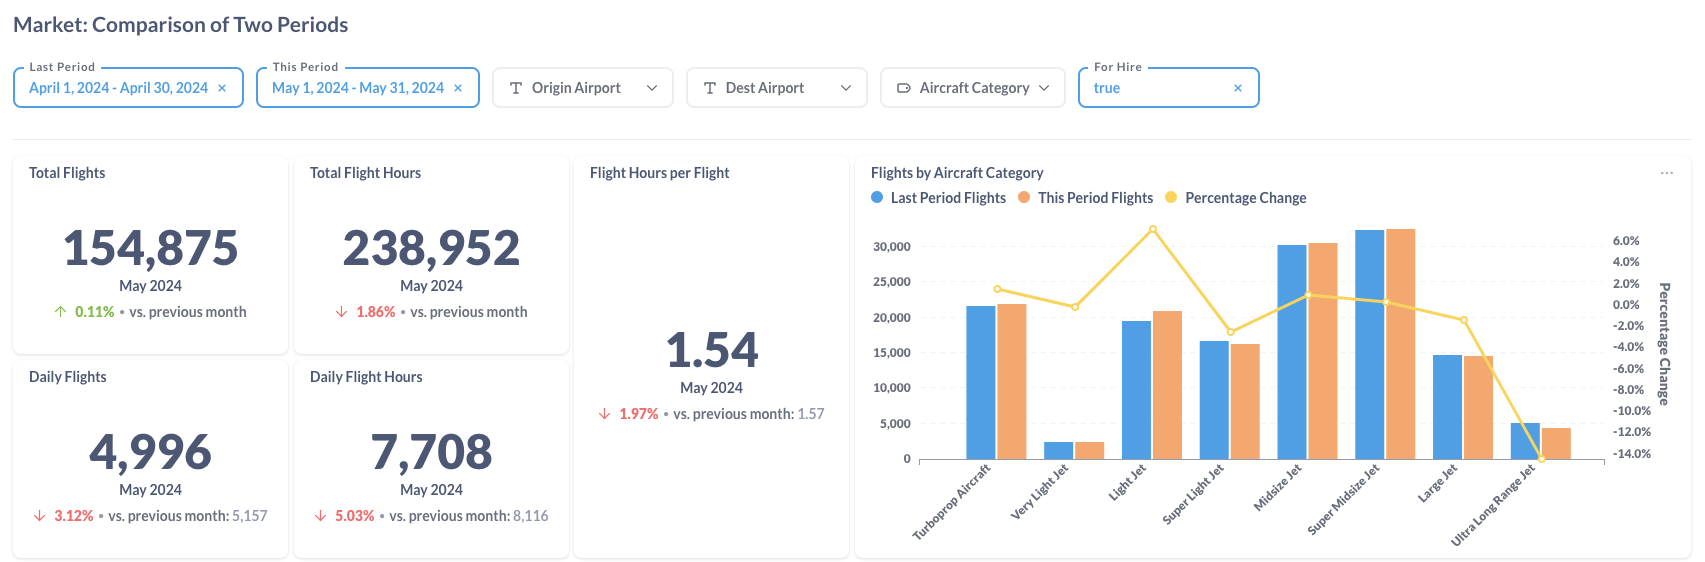
Figure 2: Comparison of the U.S. BizAv Flights This Month vs. Last Month
Figure 2 presents a comparative analysis of flight data for April 2024 and May 2024, indicating a 3.12% decrease in daily flight frequency. Daily flight hours experienced a more significant decline of 5.03%, attributed to a reduction in average flight duration per departure. This decrease in average flight duration was influenced by a 14.5% drop in flight activities for Ultra Long Range Jets.
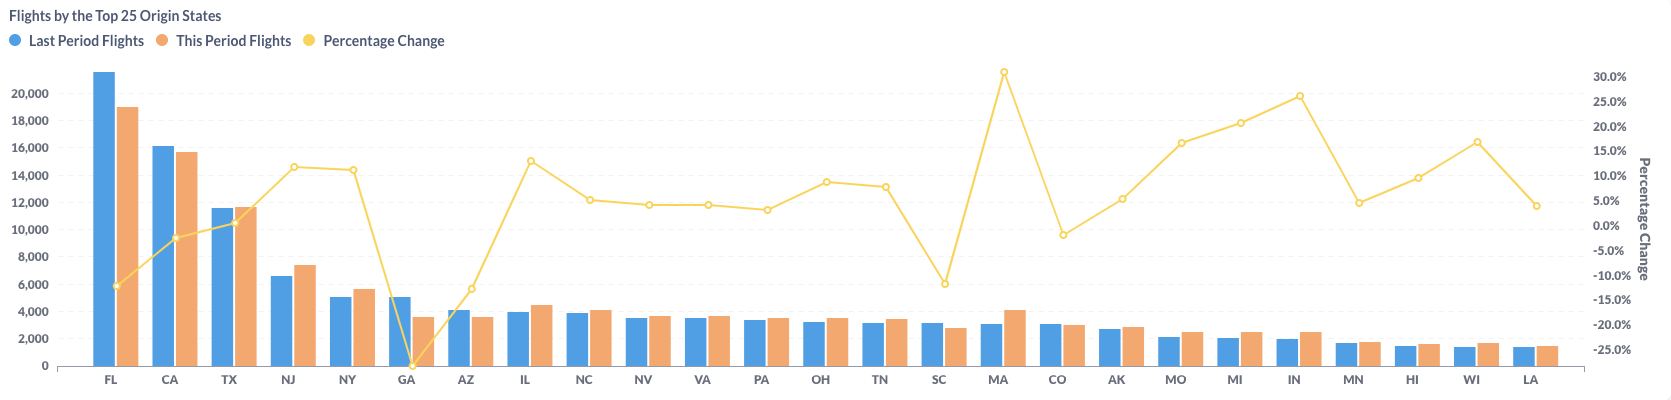
Figure 3: Comparison of the U.S. BizAv Flights by the Top 25 Origin States (This Month vs. Last Month)
In April and May 2024, business aviation activity varied among different U.S. states. The largest states, Florida (FL) and California (CA), saw decreases of 12.1% and 2.4%, respectively. Particularly, Georgia (GA) experienced the most substantial decline, while Massachusetts (MA) achieved the highest growth among the top 25 states.
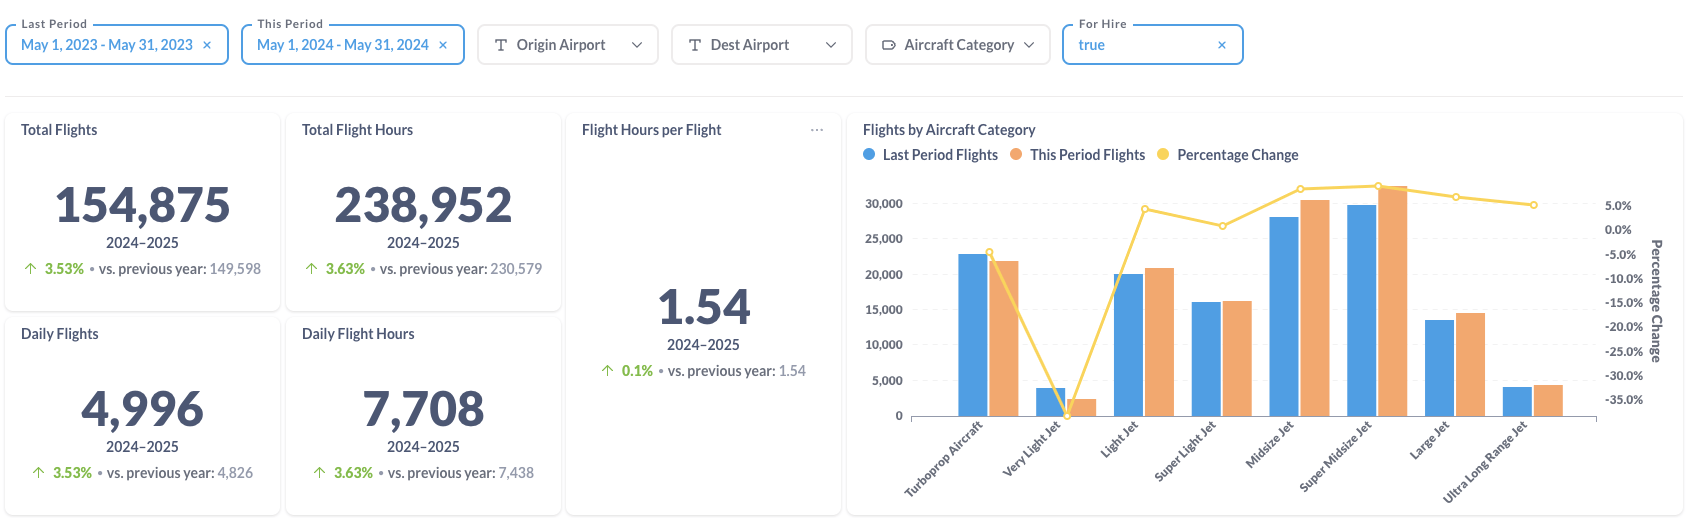
Figure 4: Comparison of the U.S. BizAv Flights This Year vs. Last Year
In May of this year, there was a 3.53% rise in the number of flights and a 3.63% increase in daily flight hours compared to May 2023. This boost can be attributed to a 0.1% increase in average flight hours per flight. However, Very Light Jets saw a notable decline of 38.3%. On the flip side, other aircraft categories from Light Jets to Ultra Long Range Jets experienced increases.
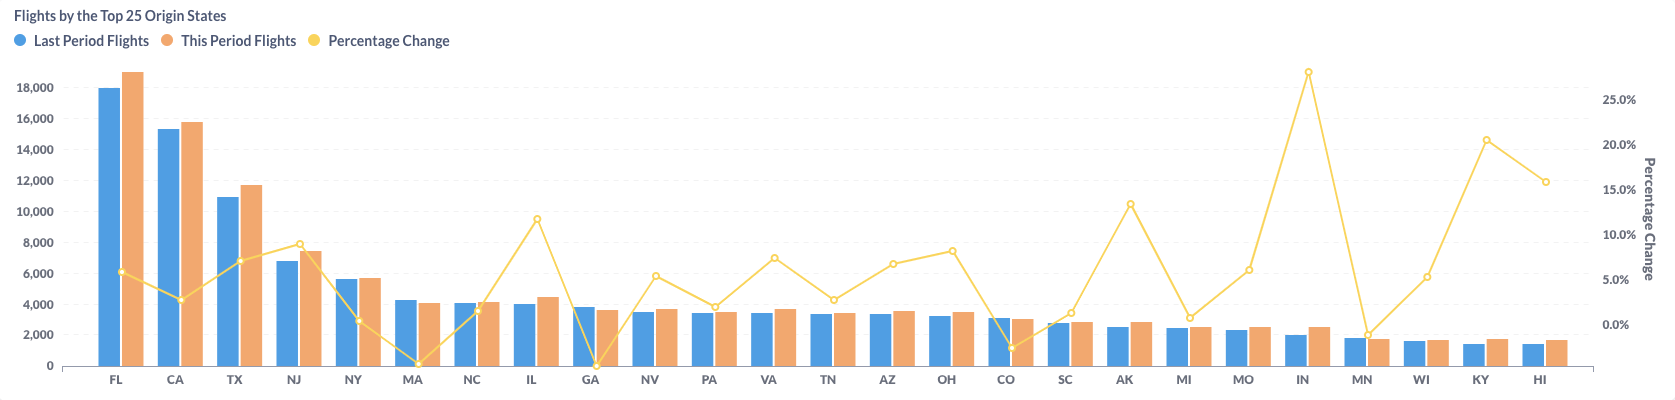
Figure 5: Comparison of the U.S. BizAv Flights by the Top 25 Origin States (This Year vs. Last Year)
Comparing flight data from May 2023 to May 2024, most major states witnessed an upsurge in total flight activity. Florida (FL), California (CA), and Texas (TX), the top three states by activity, all exhibited growth in their flight operations, with growth rates of 5.8%, 2.8%, and 7.1%, respectively. However, Massachusetts (MA) and Georgia (GA) experienced declines of 4.4% and 4.6%, respectively.