The US BizAv (Business Aviation) market has been booming since March 2021. This series of articles track the traffic trend of this market. We define the BizAv market as part-135 on-demand for-hire private flying by business jets or certain turboprop planes. The numbers in the following charts exclude part-91 private flights. If you are interested in all flights by business jets, or detailed flights by route and operator, please get in touch with us.
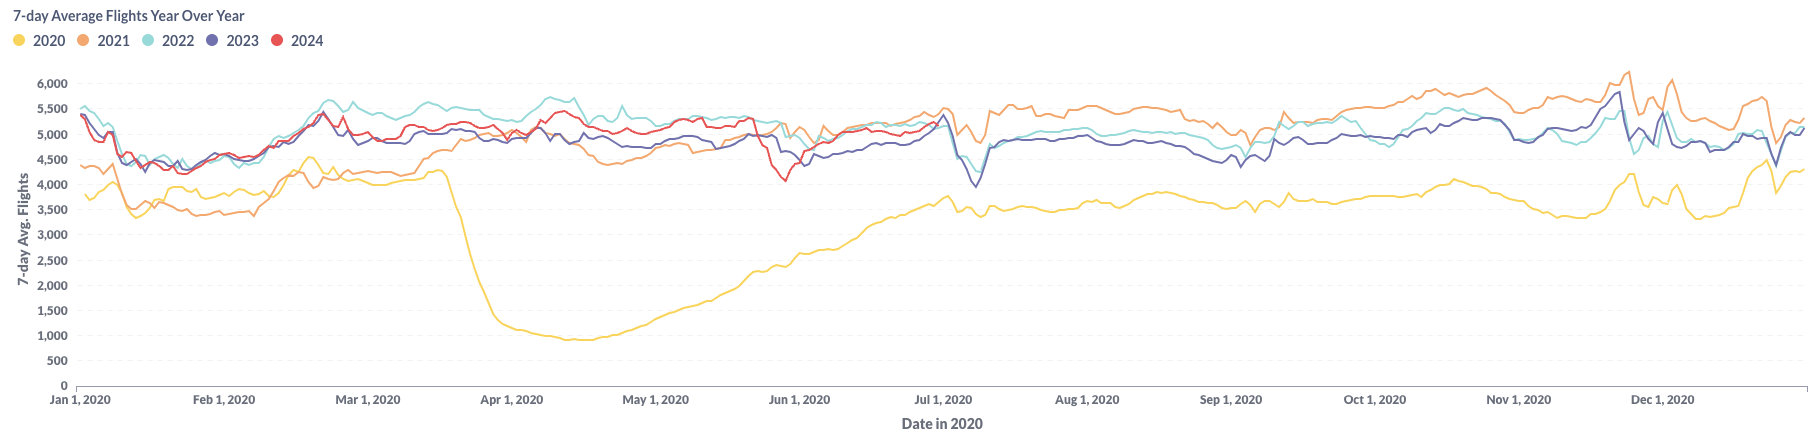
Figure 1: Year over Year Trend of the U.S. BizAv Market
Figure 1 depicts the trends in U.S. Business Aviation (BizAv) traffic from January 2020 through June 2024. In June 2024, business flight activities in the U.S. rebounded to normal levels following a decline in May. Throughout most of June, the 7-day average exceeded levels seen in 2023, yet it still remains below the peak observed in 2021.
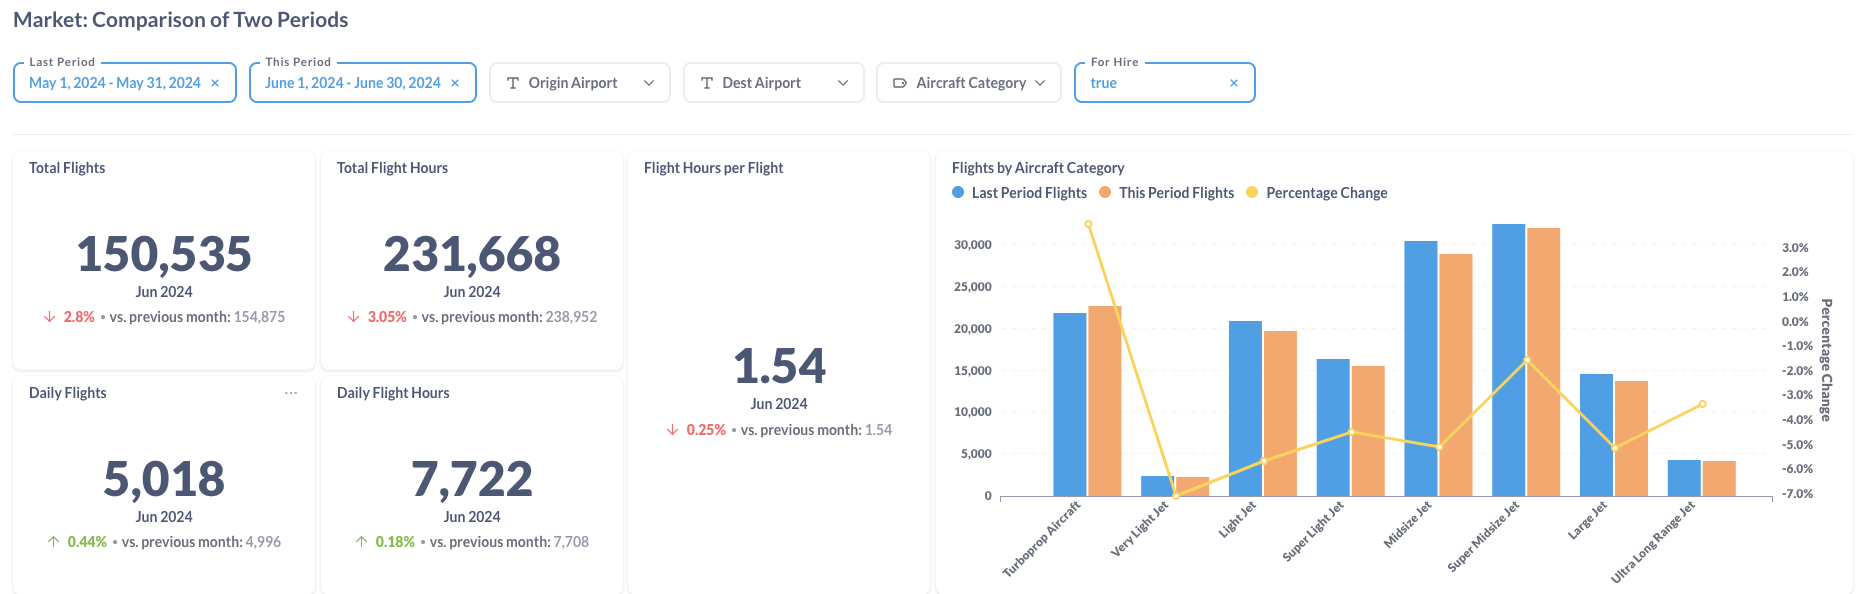
Figure 2: Comparison of the U.S. BizAv Flights This Month vs. Last Month
Figure 2 provides a comparative analysis of flight data for May 2024 and June 2024, revealing a 0.44% increase in daily flight frequency. However, daily flight hours showed a more modest growth of 0.18%, mainly due to a decrease in average flight duration per departure. This reduction in average flight duration was evident in the rise of flights by Turboprop Aircraft, whereas other aircraft categories experienced declines.
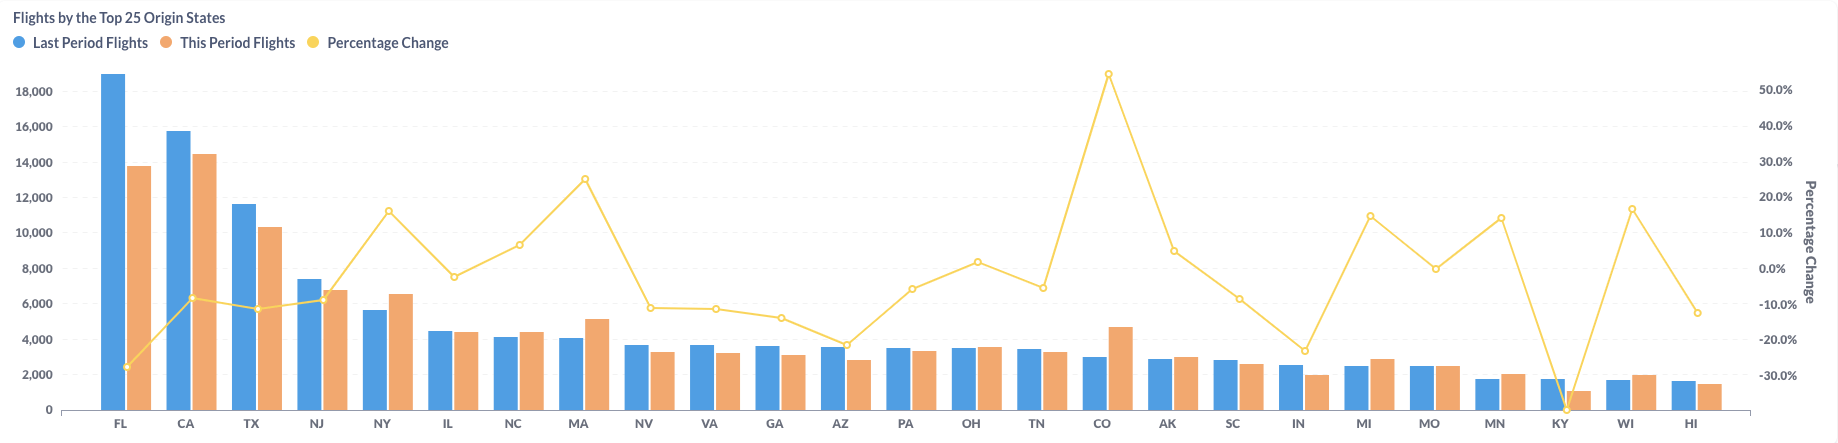
Figure 3: Comparison of the U.S. BizAv Flights by the Top 25 Origin States (This Month vs. Last Month)
In May and June 2024, business aviation activity varied across different U.S. states. Florida (FL), previously the largest state in terms of activity, experienced a significant decline of 27.4% and lost its top ranking. California (CA) and Texas (TX), the next largest states, also saw decreases of 8.2% and 11.1%, respectively. In contrast, several other states, including New York (NY), Massachusetts (MA), and Colorado (CO), achieved notable increases of 16.1%, 25.3%, and 54.5%, respectively.
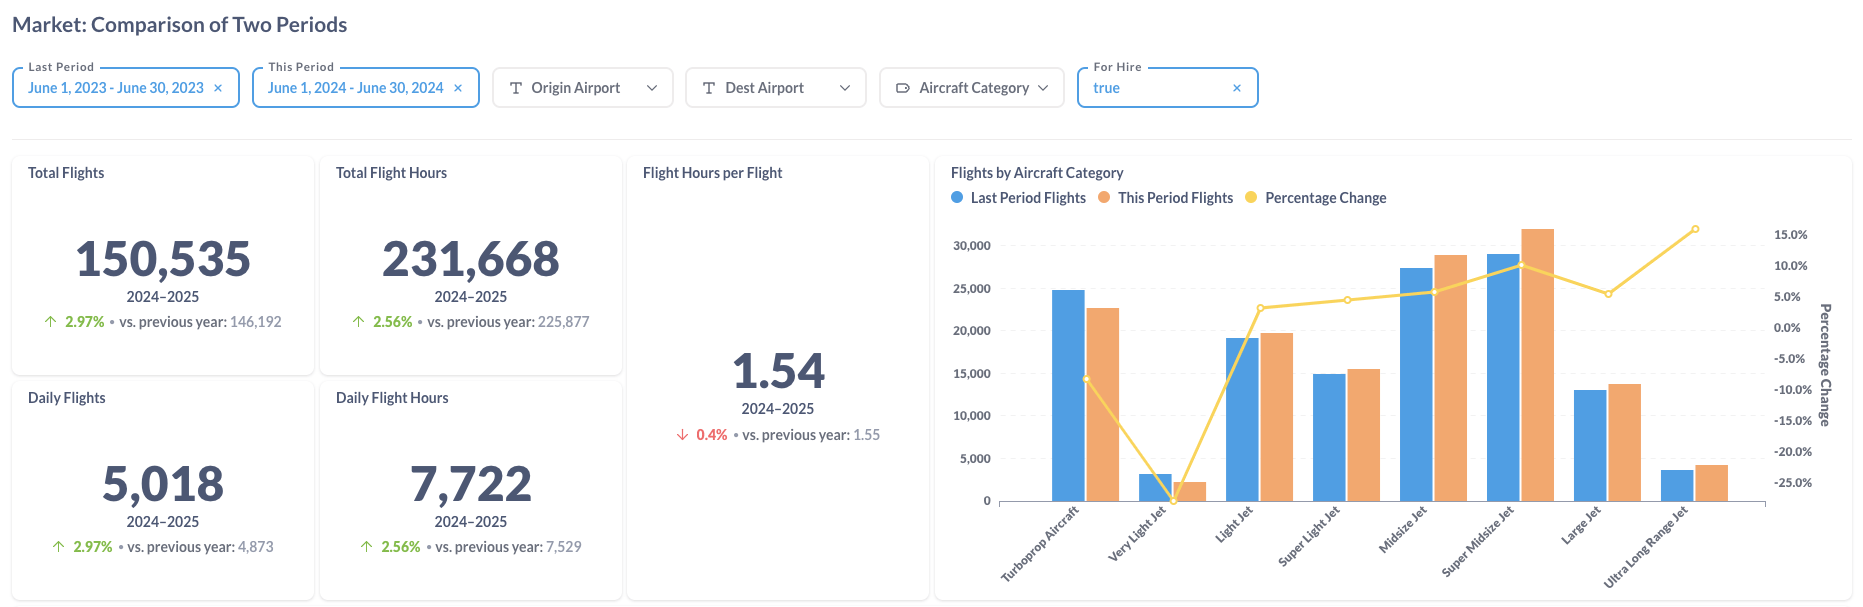
Figure 4: Comparison of the U.S. BizAv Flights This Year vs. Last Year
In June of this year, there was a 2.97% increase in the number of flights and a 2.56% rise in daily flight hours compared to June 2023. This difference is attributed to a 0.4% decrease in average flight hours per flight. Among aircraft categories, Turboprop and Very Light Jet flights declined by 8.3% and 28.0%, respectively. Conversely, other categories from Light Jets to Ultra Long Range Jets saw increases in activity.
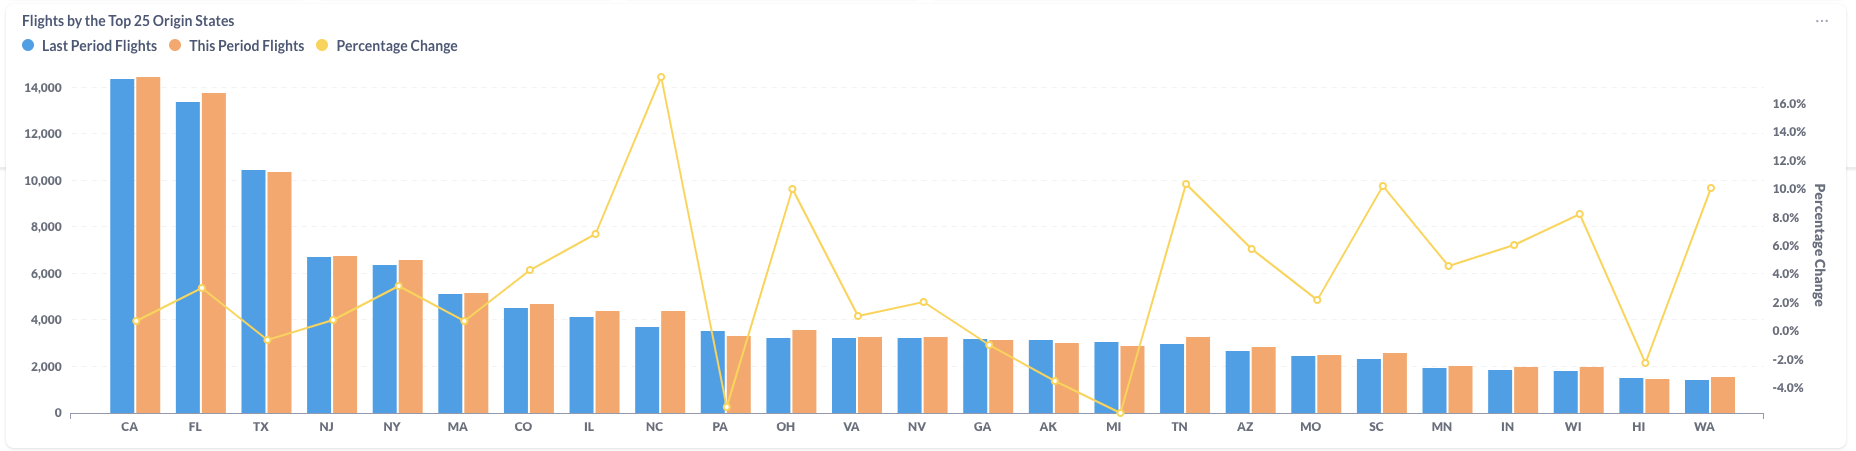
Figure 5: Comparison of the U.S. BizAv Flights by the Top 25 Origin States (This Year vs. Last Year)
Comparing flight data from June 2023 to June 2024, most major states experienced a slight increase in total flight activity. California (CA) and Florida (FL) both showed year-over-year growth, with a change in their rankings. However, Texas (TX) saw a slight decrease of 0.6% in flights compared to the previous year.