The US BizAv (Business Aviation) market has been booming since March 2021. This series of articles track the traffic trend of this market. We define the BizAv market as part-135 on-demand for-hire private flying by business jets or certain turboprop planes. The numbers in the following charts exclude part-91 private flights. If you are interested in all flights by business jets, or detailed flights by route and operator, please get in touch with us.
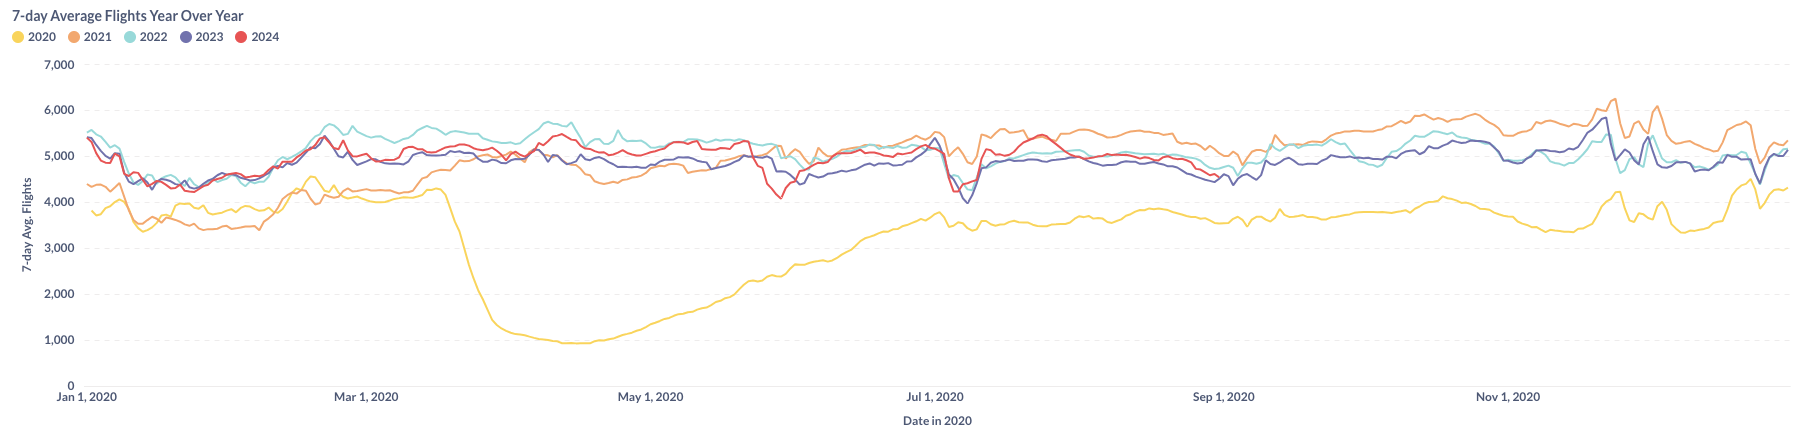
Figure 1: Year over Year Trend of the U.S. BizAv Market
Figure 1 shows the trends in U.S. Business Aviation (BizAv) traffic from January 2020 to August 2024. In August 2024, business flight activity in the U.S. dropped to levels similar to those seen between 2022 and 2023. Despite this, the 7-day average for most of August showed a slight year-over-year increase.
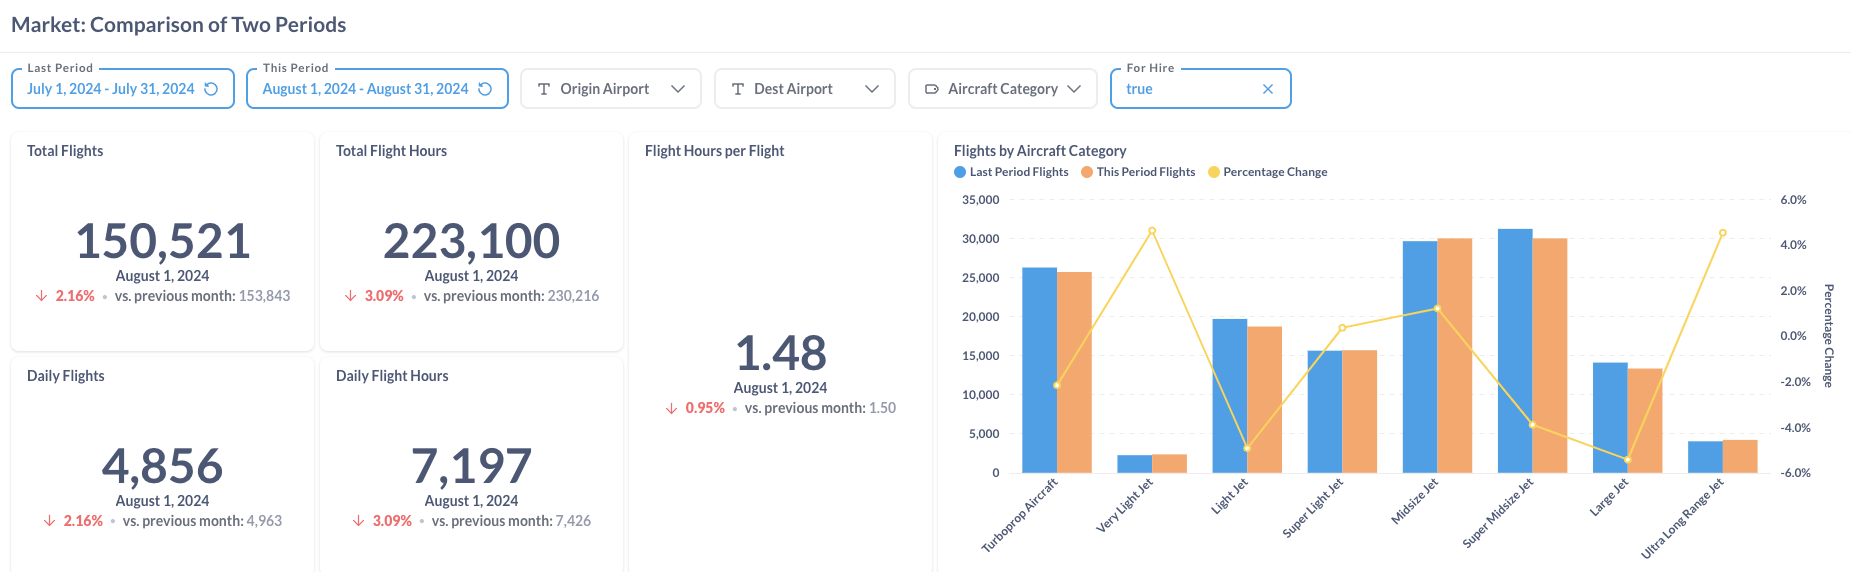
Figure 2: Comparison of the U.S. BizAv Flights This Month vs. Last Month
Figure 2 provides a comparative analysis of flight data for July and August 2024, showing a 2.16% decrease in daily flight frequency. Additionally, daily flight hours declined by 3.09%, driven by both a reduction in flight hours and a decrease in the average flight duration per departure. This reduction in average flight duration was primarily due to fewer flights by Super Midsize Jets and Large Jets.
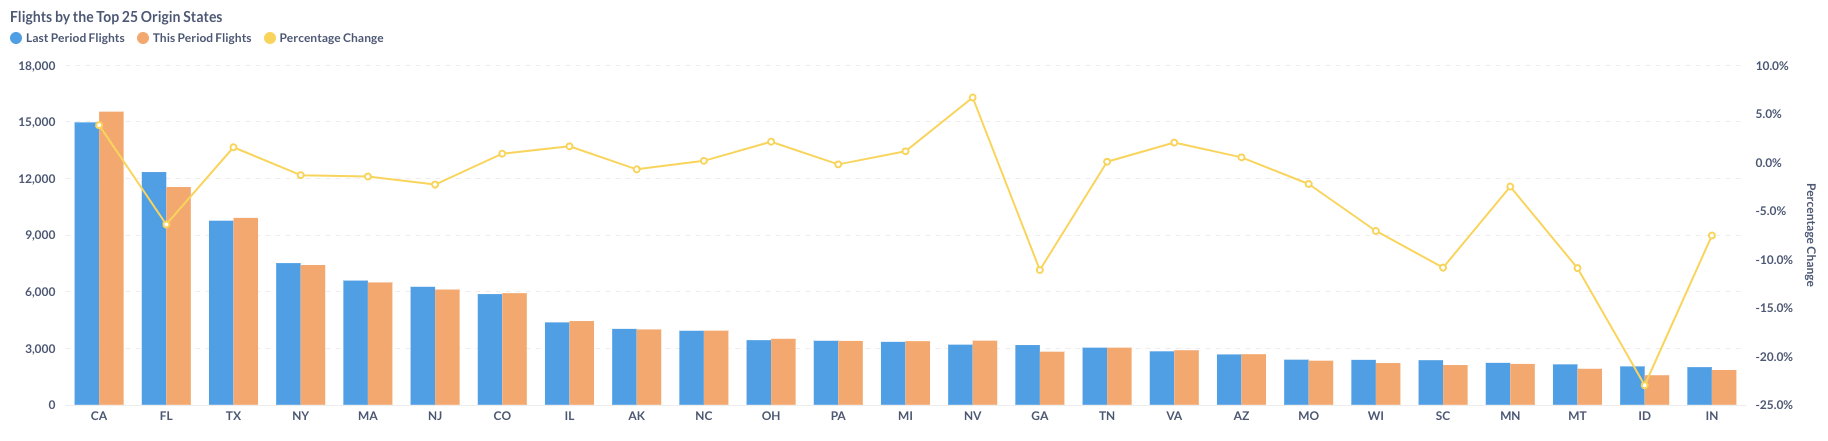
Figure 3: Comparison of the U.S. BizAv Flights by the Top 25 Origin States (This Month vs. Last Month)
In July and August 2024, business aviation activity varied across different U.S. states. California (CA) saw a growth of 3.8%, Florida (FL) experienced a decline of 6.4%, and Texas (TX) had a slight increase of 1.5%. Nevada (NV) recorded the highest growth among the top states at 6.7%, while Indiana (IN) experienced the most significant decrease at 23%.
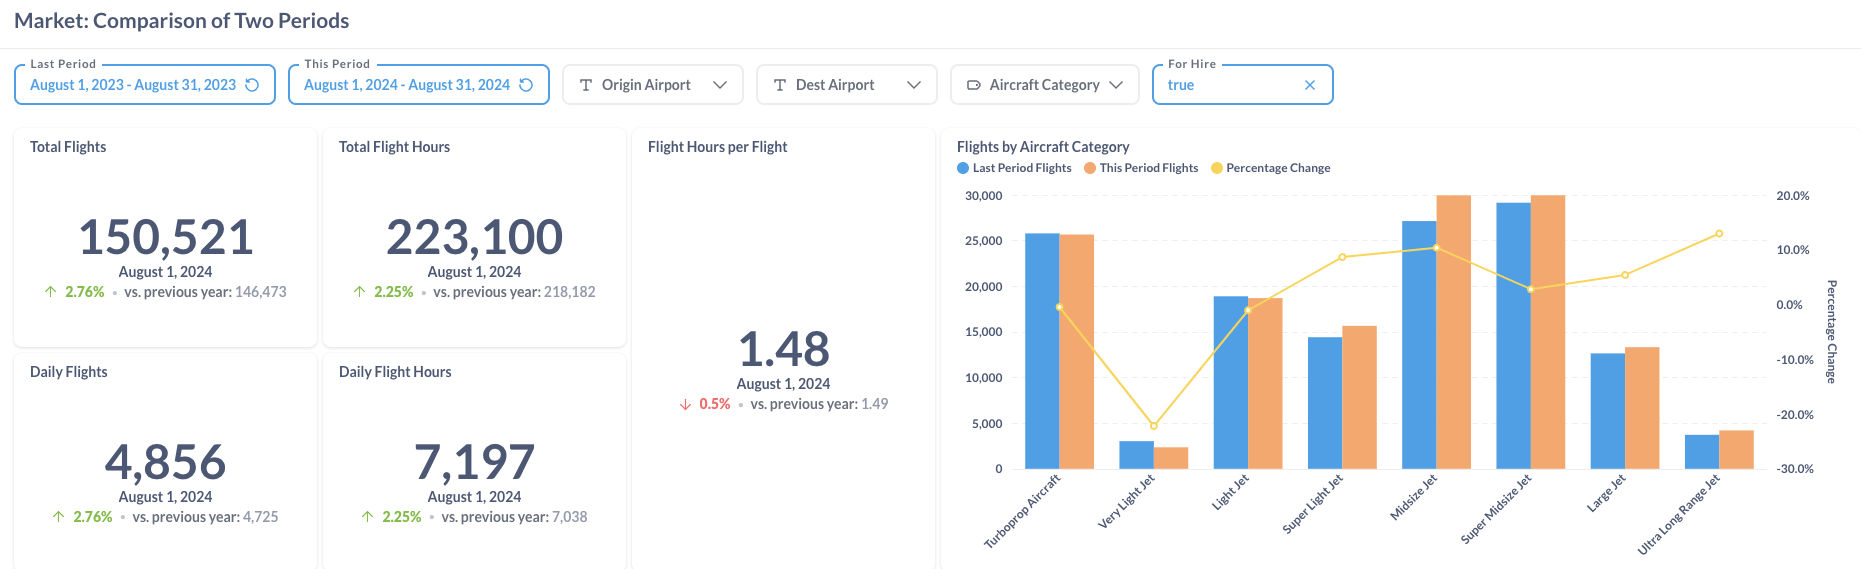
Figure 4: Comparison of the U.S. BizAv Flights This Year vs. Last Year
In August 2024, there was a 2.76% increase in the number of flights and a 2.25% rise in daily flight hours compared to August 2023, despite a 0.5% decrease in average flight hours per flight. Very Light Jet flights declined by 22.2%, while other larger categories, from Super Light Jets to Ultra Long Range Jets, saw activity increases ranging from 2.8% to 13.0%.
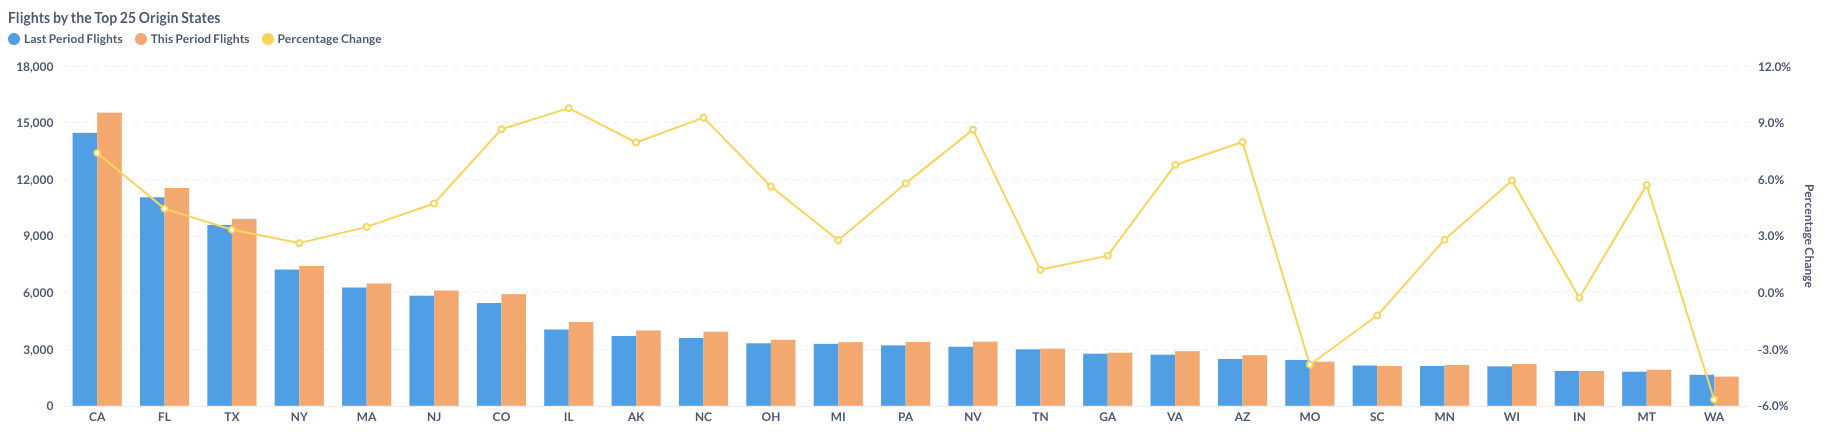
Figure 5: Comparison of the U.S. BizAv Flights by the Top 25 Origin States (This Year vs. Last Year)
Comparing flight data from August 2023 to August 2024, most major states experienced an increase in total flight activity. However, smaller states like Missouri (MO) and Washington (WA) saw declines of 3.8% and 5.7%, respectively, compared to last year.