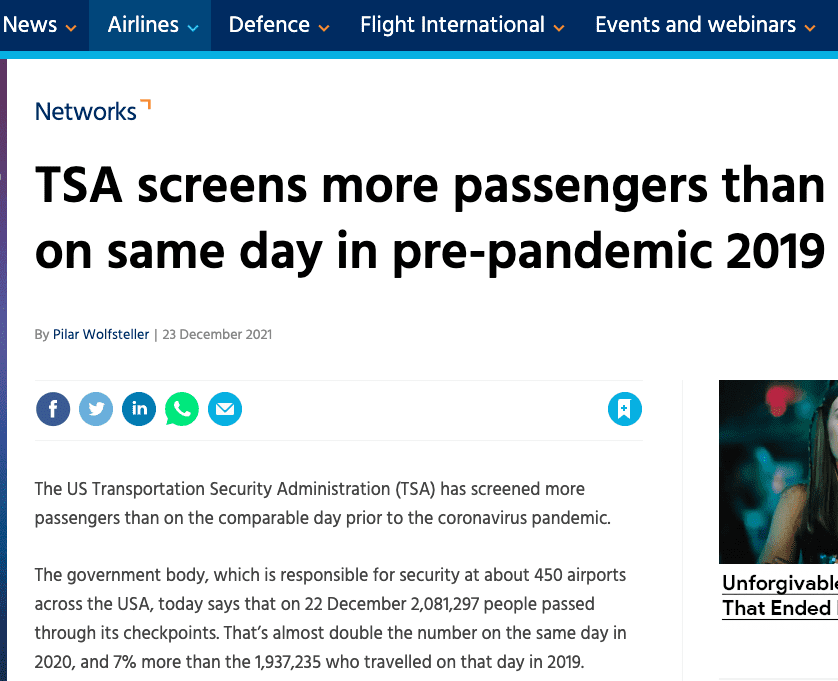
People in the aviation industry, including us, are eager to see the air traffic coming back. Therefore, when US TSA published the recent airport passenger throughput numbers, reporters claimed that the air passenger number at about 450 airports across the USA on December 22 has been 7% more than the same day in 2019. Is that true?
TSA’s numbers are correct, but their comparison is “current year versus prior year(s)/same weekday”. December 22nd, 2021 is a Wednesday. The corresponding Wednesday in 2019 is December 25th. Ho Ho Ho! We all know which day December 25th is. Obviously, not many people chose to travel on the exact Christmas day. In contrast, December 22nd is one of the busiest travel days before Christmas. Therefore, the “good” news is not good anymore when the comparison is apples versus oranges.
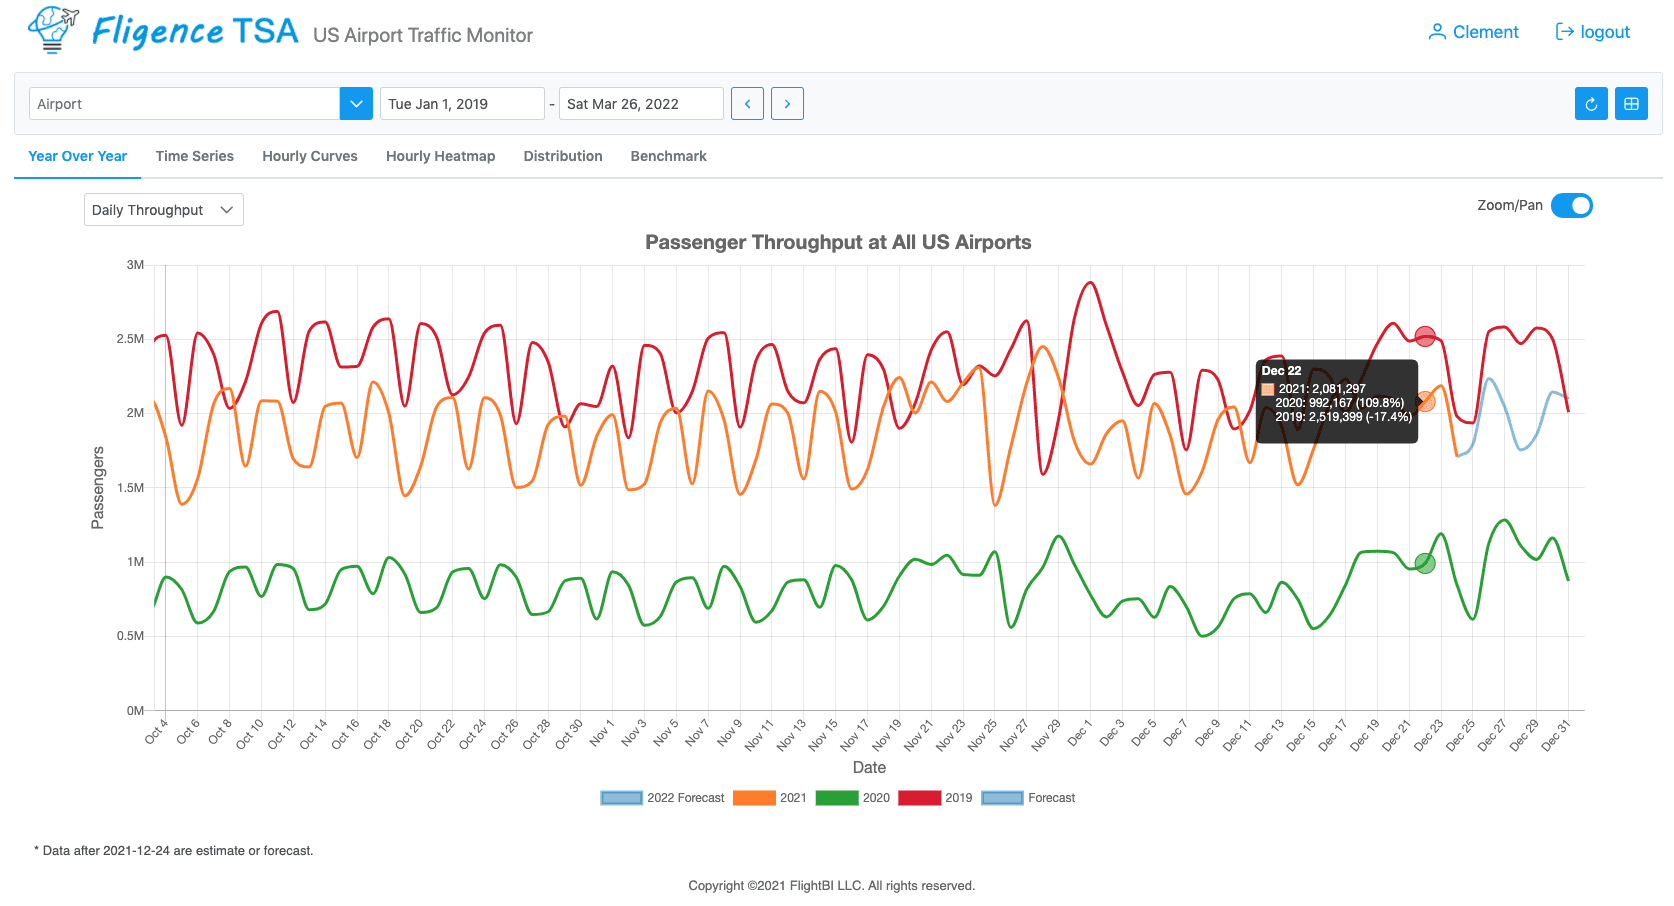
The above chart shows the same date comparison. As shown in the popup, there were 2,081,297 passengers on December 22nd, 2021, compared to 2,519,399 on December 22nd, 2019. We are still 17.4% below the pre-pandemic level. Of course, the situation is much better than last year. The number on December 22nd this year is 109.8% higher than the number on that day last year.
A comparison of traffic on the same date in different years has its drawback. The “M” shapes in the above chart indicate a clear pattern for different weekdays: Tuesdays/Wednesdays are the valleys while Thursday/Friday and Sunday/Monday are the peaks. Saturdays are lower than Thursdays/Fridays and Sundays/Mondays but higher than Tuesdays/Wednesdays. That’s because many leisure travelers depart on Fridays and come back on Sundays while many business travelers leave on Mondays and return on Fridays. To avoid the impact of weekdays, we’d better look at the trend using a 7-day average. As shown in the chart below, the gap between the 2021 orange line and the red 2019 red line is shrinking, although the US air traffic hasn’t reached the pre-pandemic level yet.
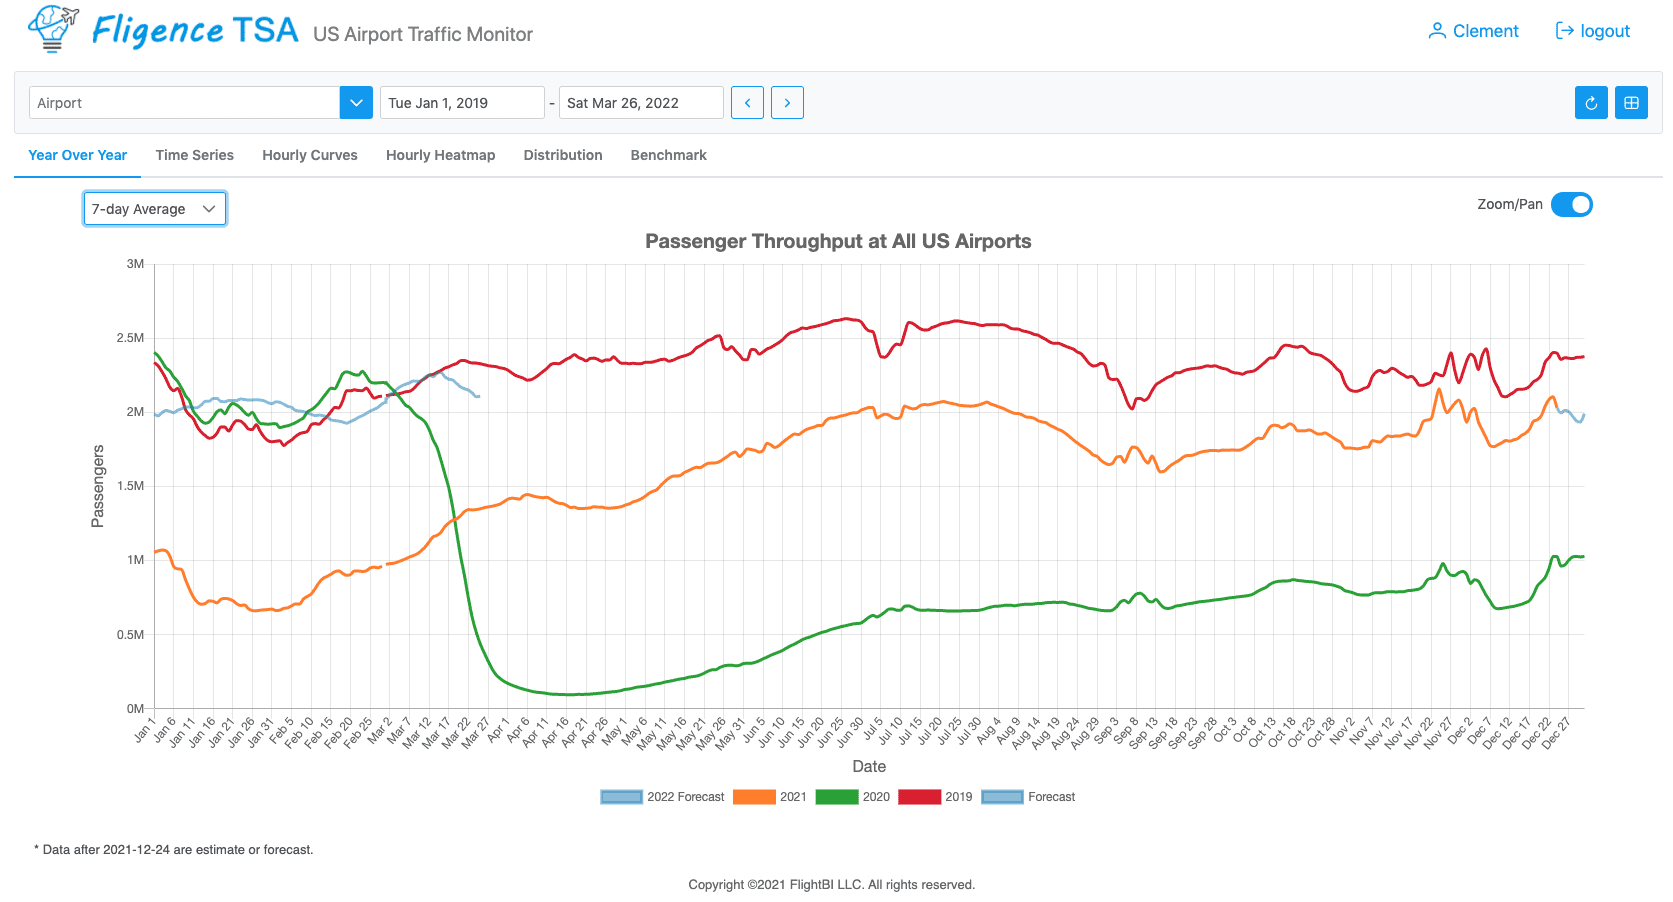
The Omicron variant of COVID-19 put another damper on the air traffic recovery. However, we are still optimistic about the trend. Our forecast shows that the overall US air traffic may exceed the 2019 level in the second half of January 2022, although the recovery road is still bumpy.
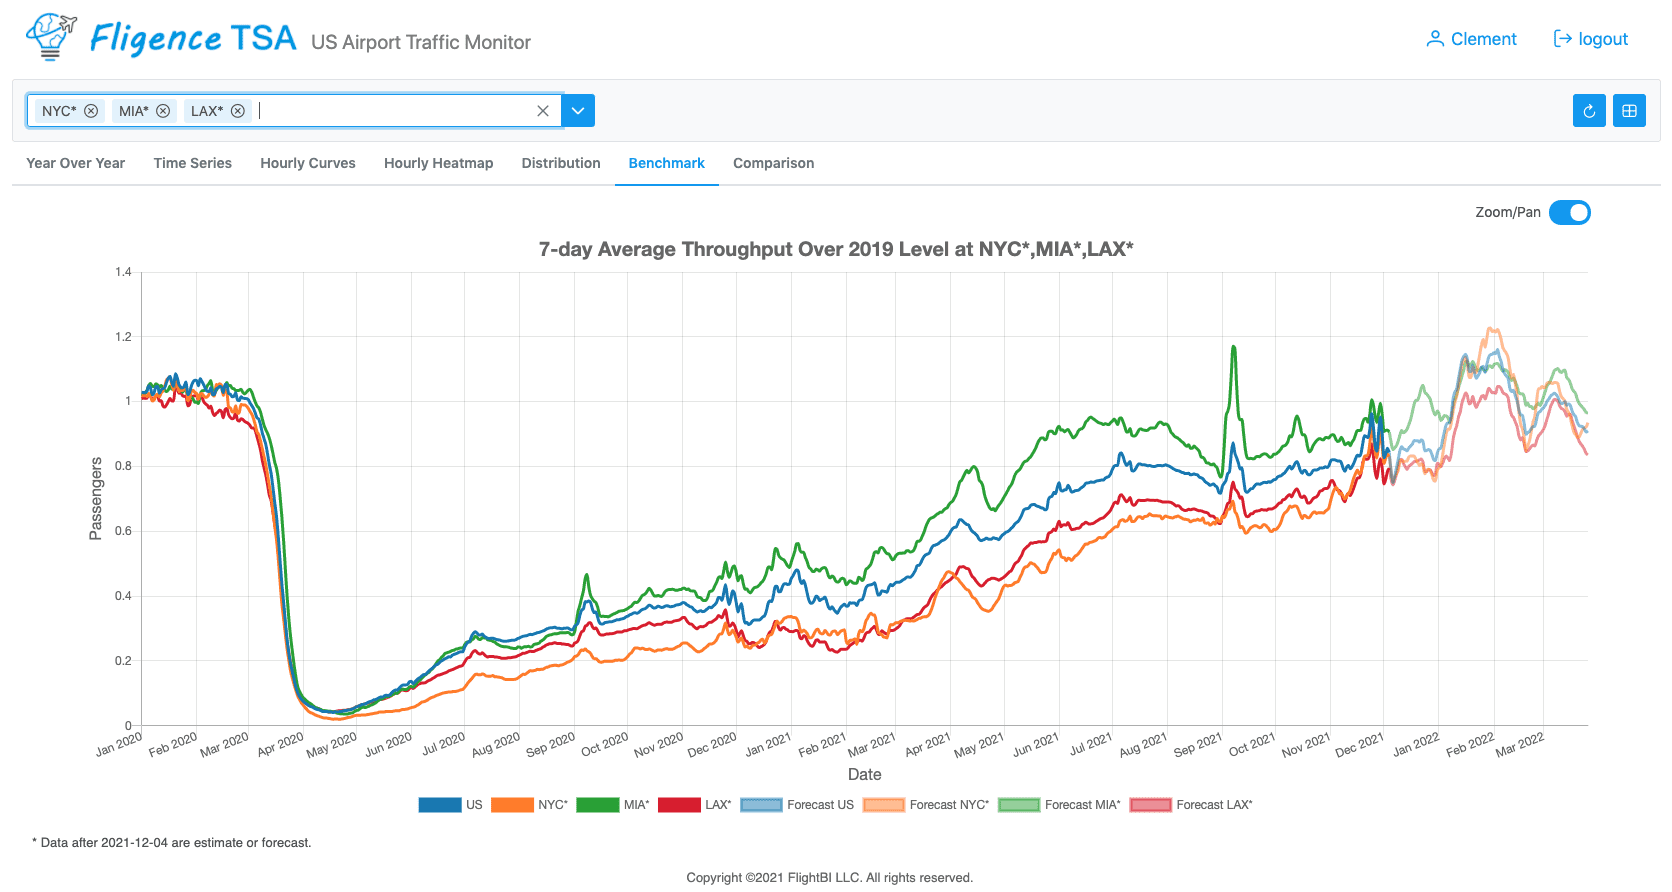
From another perspective, traffic recovery in some cities is faster than the national average. For example, the current air traffic from/to Miami metropolitan area is almost at the same level in 2019. But traffic from/to New York or Los Angeles is lagging. The good news is that the overall trend is upward in almost all airports.