With our tailored cloud-based BI solution, you can unlock valuable insights from aviation data in the first month. Our solution is designed to meet the specific needs of the aviation industry. With our powerful analytics tools and visualization capabilities, you can gain a deeper understanding of the market and your own business quickly.
Using our cloud-based approach, you can begin experiencing value almost immediately, with no disruption to your business operations. We take care of the infrastructure and implementation, allowing you to focus on the insights that matter most to your business.
Our solution is scalable and flexible, so you can easily expand the data you want to analyze as your needs evolve. This ensures that you always have access to the resources you need, without incurring unnecessary costs. At the end of the project, you’ll have a comprehensive BI solution in place that enables you to make data-driven decisions and achieve your business goals more effectively. With our expertise and technology, we’re confident that we can help you unlock the full potential of your data and take your business to the next level.
Case One
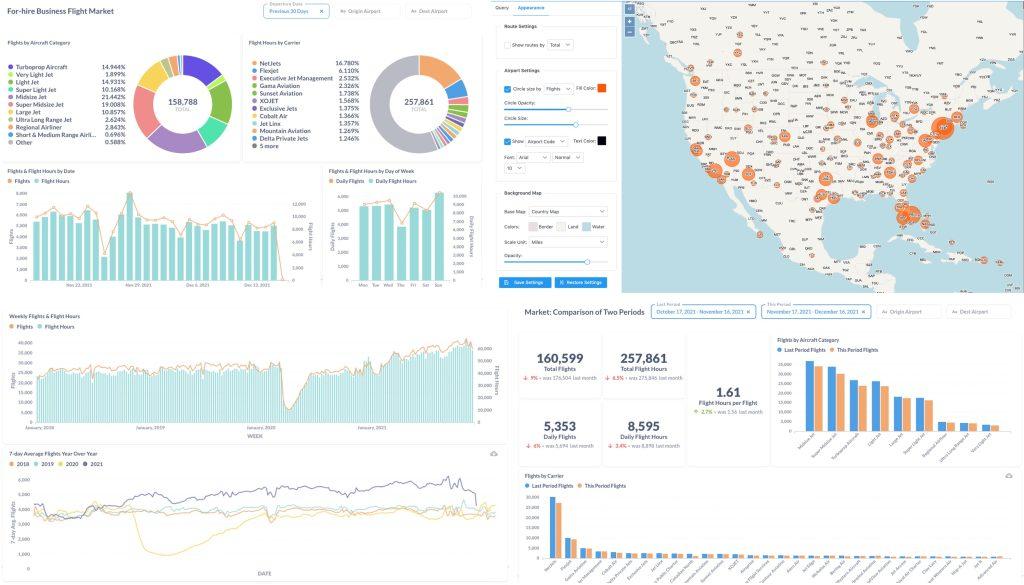
We built eight dashboards for a US business aviation operator to identify market opportunities in less than two weeks. The purpose of the project was to help the operator identify potential opportunities within the market.
To achieve this goal, we collected market data from the Federal Aviation Administration (FAA), as well as operational data from the client. We analyzed the data and created multiple dashboards to track business aviation activities and market growth. These dashboards provided various metrics and insights, such as market shares by operators and aircraft category.
Through the analysis, the team identified event-driven demand for business jets, which helped the operator to plan and respond accordingly. Additionally, we identified regions with more growth potential, which allowed the operator to focus their efforts on expanding their business in those areas.
Case Two
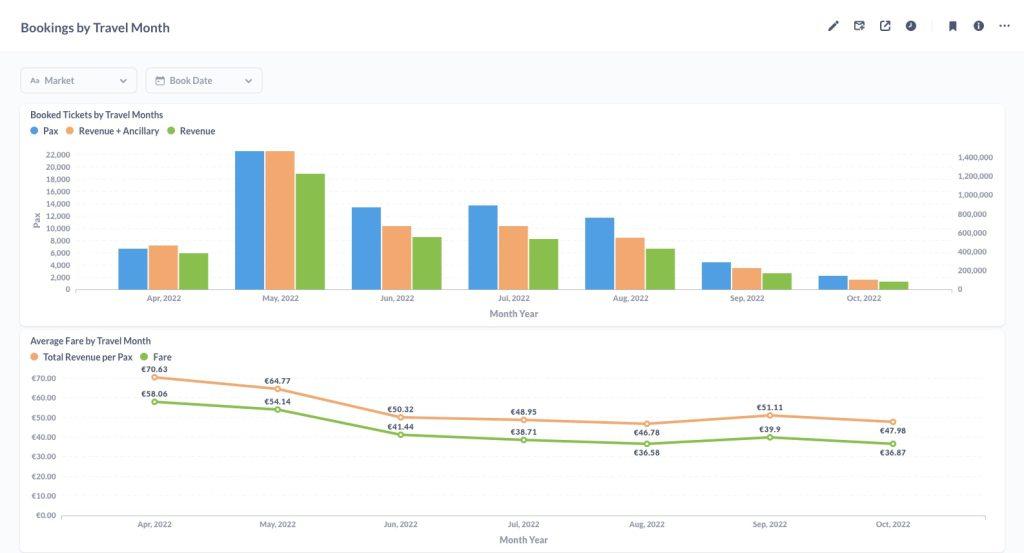
We normalized sales and financial data and designed six dashboards for a low-cost carrier (LCC) startup in two weeks to track revenue and cost build-up.
The booking build-up dashboard displays the number of bookings over time. This feature enables the LCC startup to track their bookings and identify booking patterns over time. The market-specific revenue and cost dashboard displays revenue, cost, and profit by market, enabling the LCC startup to analyze their performance in different markets and identify areas for improvement.
Furthermore, the fare revenue versus ancillary charges dashboard compares the revenue generated by ticket fares versus ancillary charges, providing the LCC startup with insights into their ancillary services.
Overall, these dashboards provide the LCC startup with a comprehensive overview of their sales and financial data, enabling them to make informed business decisions based on near real-time data.
Case Three
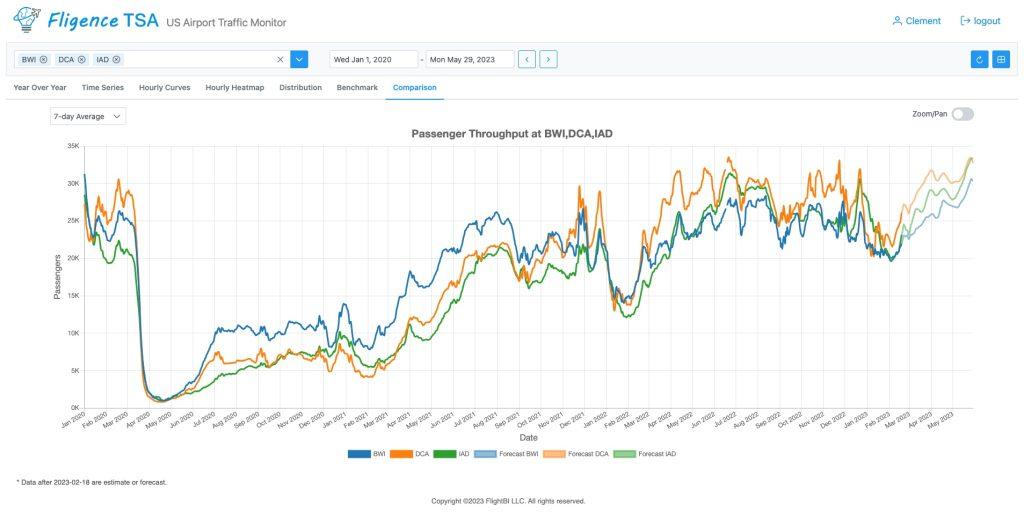
We developed the first version of US airport traffic monitor with forecast in a month. This product includes various features such as year over year comparison, airport benchmarking, hourly traffic curve and matrix, geographic distribution map, and data table display and export.
With the year over year comparison feature, you can easily compare the current airport traffic with that of the previous year, enabling you to identify trends and patterns quickly. The airport benchmarking feature provides a comprehensive overview of how your airport is performing compared to others in the same region, allowing you to identify areas of improvement and implement changes accordingly.
The hourly traffic curve and matrix feature displays the traffic trends throughout the day, enabling you to optimize staffing and resources accordingly. Additionally, the geographic distribution map feature provides an interactive map display of the traffic distribution across different locations, which can help you identify high traffic areas and plan for capacity needs.
Lastly, the data table display and export feature enables you to extract the data in various formats, providing you with the flexibility to analyze the data as per your business needs.