In March 2026, something unprecedented showed up in TSA throughput data at Hartsfield-Jackson Atlanta International Airport: A 90–95% collapse in 7-day average passenger throughput compared to prior years.
At first glance, this looks like a demand shock. But a deeper look at the data — across time series, hourly heatmaps, and checkpoint distribution — tells a very different story.
ATL is the busiest airport in the world by total passenger traffic. However, A large portion of ATL passengers are connecting (in transit) and do not pass through TSA checkpoints. This means TSA throughput primarily reflects originating passengers (O&D), not total airport traffic.
So even under normal conditions: TSA data ≠ total ATL passenger volume
The headline: a 90–95% drop in throughput
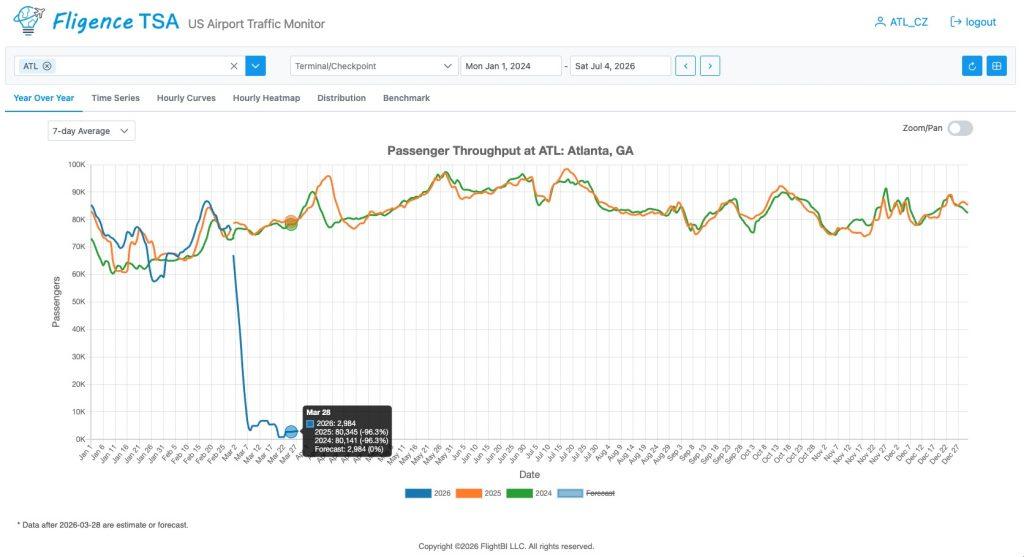
The time series chart in Figure 1 shows a dramatic collapse in mid-March: from ~80–90K daily passengers down to just a few thousand. That’s a near-system shutdown level drop.
But here’s the key question: Did ATL actually lose ~90% of its passengers?
The answer is: No.
What the hourly data reveals
Looking at the hourly heatmap in Figure 2:
- Entire days show near-zero throughput
- Some hours (e.g., 9 AM) report 0 passengers processed
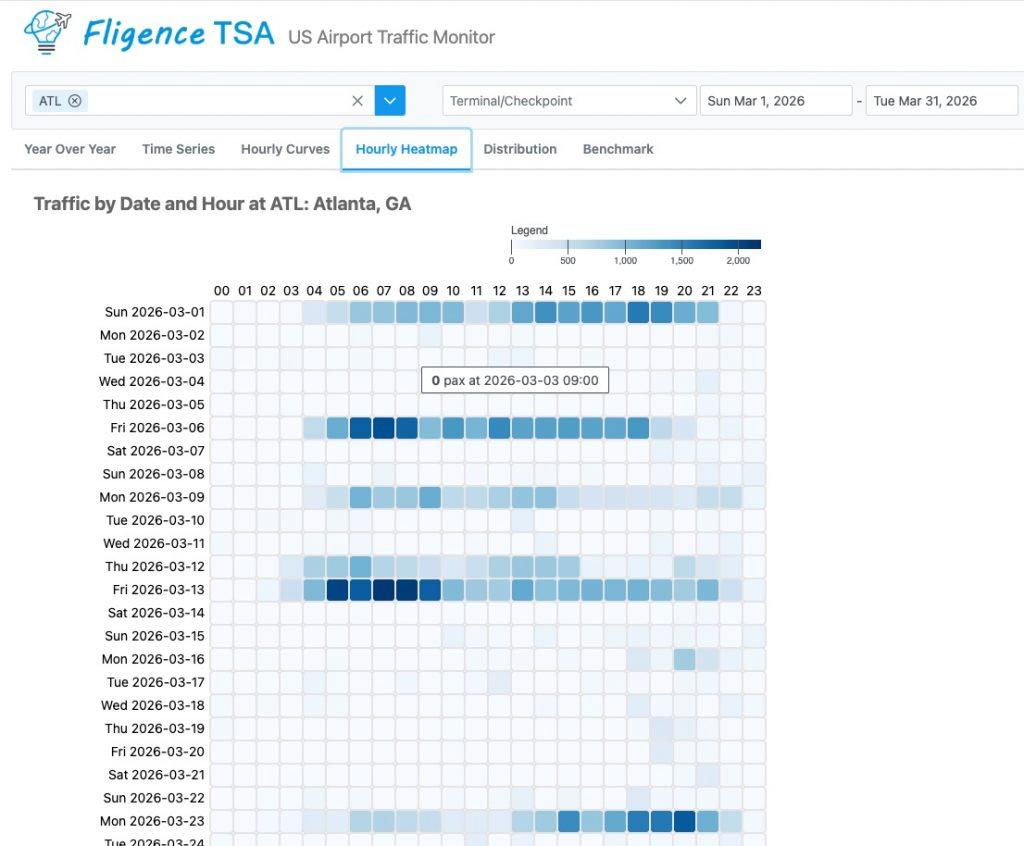
This is the most important clue. It is operationally impossible for ATL to have zero passengers clearing TSA during peak hours.
Even under extreme disruption:
- Flights were still operating
- Passengers were still traveling
- TSA checkpoints were still open
This strongly indicates: The data is incomplete — not just low.
Checkpoint distribution confirms activity still existed
The checkpoint distribution chart in Figure 3 shows:
- Main Checkpoint: ~27.8%
- North & South checkpoints: significant shares
- All checkpoints reporting some level of throughput
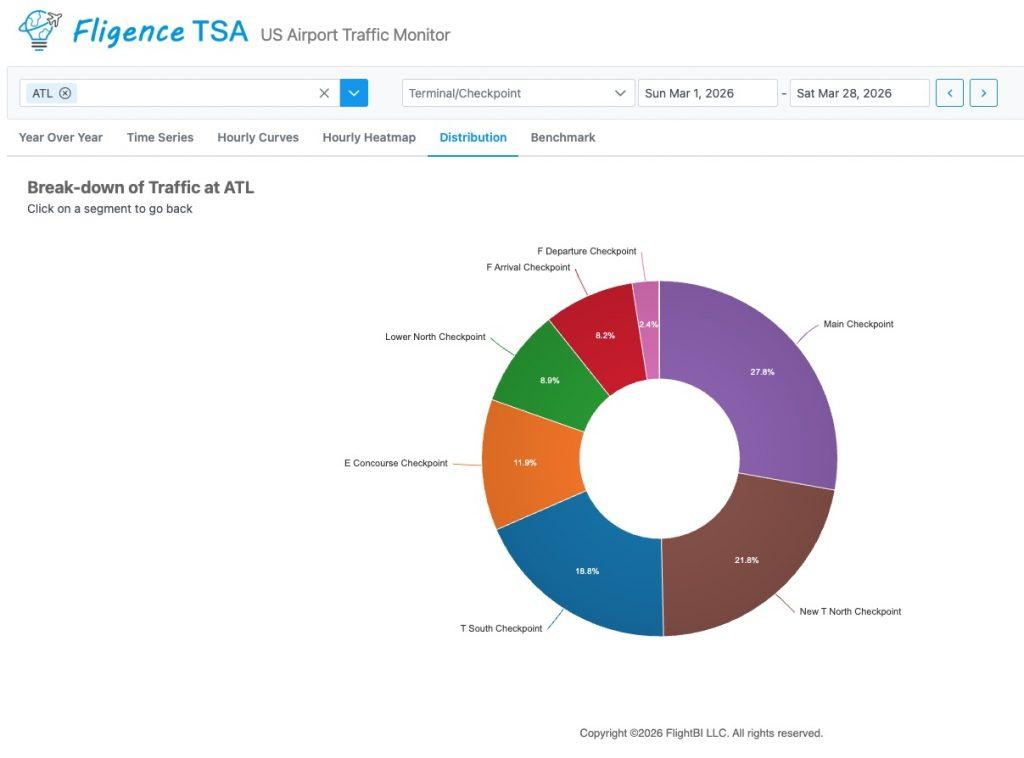
Every checkpoint still reported activity — meaning TSA operations did not fully stop.
So we have a contradiction:
- ✅ Checkpoints active
- ❌ System-level throughput near zero
The only explanation: Partial data capture or reporting gaps during disruption
What actually happened at ATL
In March 2026, there was a prolonged U.S. government shutdown, which directly impacted TSA operations.
1. Severe staffing shortages
- TSA officers were working without pay for weeks
- At ATL, ~30–36% of staff called out
2. Extreme wait times
- Lines reached 2–5+ hours
- Passengers were told to arrive 3–4 hours early
3. Operational disruptions
- Checkpoints were partially constrained
- Flights were delayed and canceled
- Some passengers missed flights entirely
4. Nationwide impact
- Similar issues occurred across major U.S. airports
- Driven by unpaid TSA workforce during shutdown
Why the data collapsed (but reality didn’t)
This event created a perfect storm of data distortion:
(A) Real capacity constraint
- Fewer TSA agents → fewer passengers processed
- Throughput genuinely declined
(B) Behavioral disruption
- Passengers missed flights
- Airlines adjusted operations
- Demand shifted across time
(C) Data visibility breakdown (most important)
- Some checkpoints likely underreported
- Aggregation pipelines likely disrupted
- Result: partial observation of total throughput
The key insight: TSA stopped measuring demand
Under normal conditions: TSA throughput ≈ originating passenger demand
But in March 2026: TSA throughput ≈ what the system could process AND what was recorded
Interpreting the 90–95% drop correctly
That extreme drop is NOT:
- ❌ A collapse in total ATL passenger traffic
- ❌ A full airport shutdown
Especially because a significant portion of ATL passengers are connecting travelers who never go through TSA, total airport activity remained far higher than TSA data suggests.
Instead, the drop reflects a combination of capacity constraint + incomplete data capture.
Why this matters for aviation analytics
This event exposes a critical limitation: Even the most trusted datasets can fail under operational stress
If you rely on TSA data:
- You may underestimate originating demand
- You may misinterpret capacity constraints as demand shocks
- You may forget that TSA excludes connecting passengers entirely
Final takeaway
The ATL TSA anomaly is not just an outlier — it’s a lesson: When infrastructure is stressed, data stops measuring reality — and starts measuring failure.
For airports, airlines, and analysts:
- Always separate origin vs connecting passengers
- Always validate against operational context
- Always ask:
Is this demand — or just what the system could process and report?
If you’re building models or dashboards using TSA data, this is exactly the type of anomaly that needs to be detected, adjusted, and explained — not taken at face value.