Traffic and fare data by airline and route can provide valuable insights into market trends, demand, and competition. By analyzing this data, airlines can optimize their pricing strategies, plan their capacity, and make informed decisions about their route network. The data can also be used for market and competitive analysis, helping airlines identify profitable routes and gain a competitive advantage.
According to initial true O&D level data released this week by FlightBI, total U.S. domestic air travel increased slightly in February 2026 while average airfares became higher. However, international travel volumes decreased during the same period.
Volume Trend
U.S. domestic passenger traffic increased to 45.9 million in February 2026, up from 45.6 million in January 2026, and became 7% higher than the 42.9 million recorded in February 2025. International volumes fell during the same period, decreasing from 20.6 million to 17.5 million.
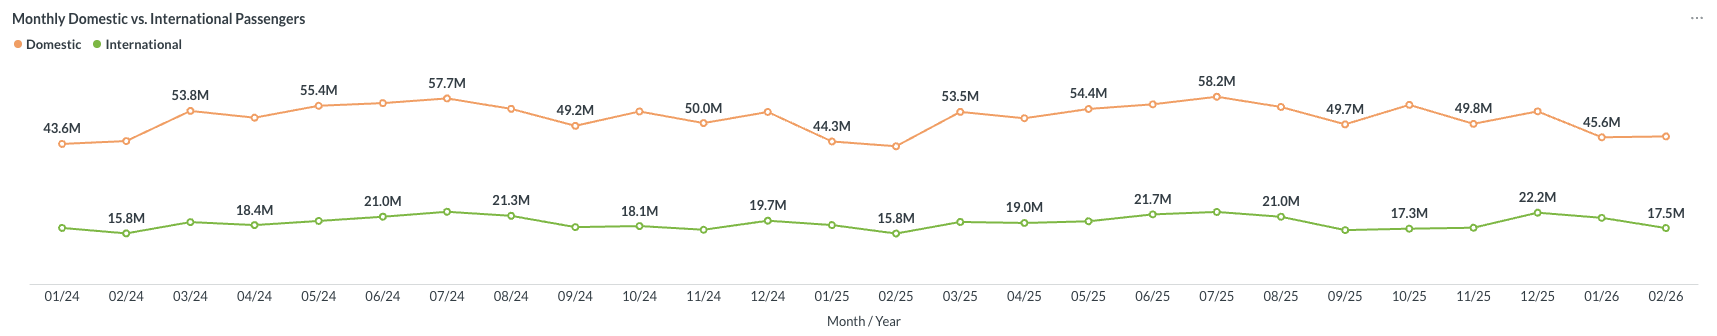
Figure 1: US Domestic and International Air Traffic by Month
Airfare Trend
Domestic airfares increased again in February 2026, with the average gross fare rising from $256 in January to $263, while the average net fare climbed from $222 to $228.
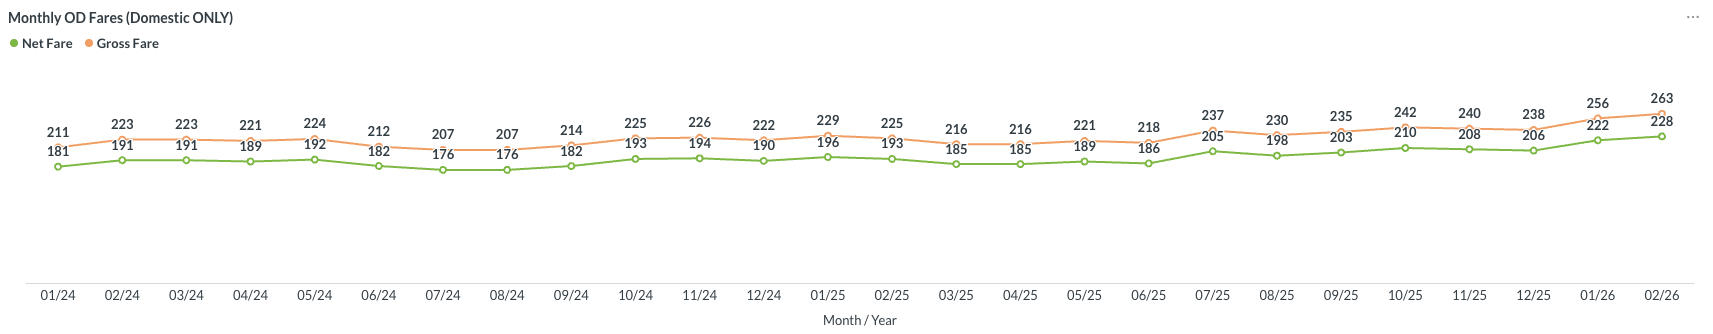
Figure 2: US Domestic Average Airfare by Month
Load Factor Trend
In February 2026, both Available Seat Miles (ASM) and Revenue Passenger Miles (RPM) declined month over month. The average load factor for major U.S. airlines retreated to 77.4%, below the 77.9% recorded in February 2025 (see Figure 3).
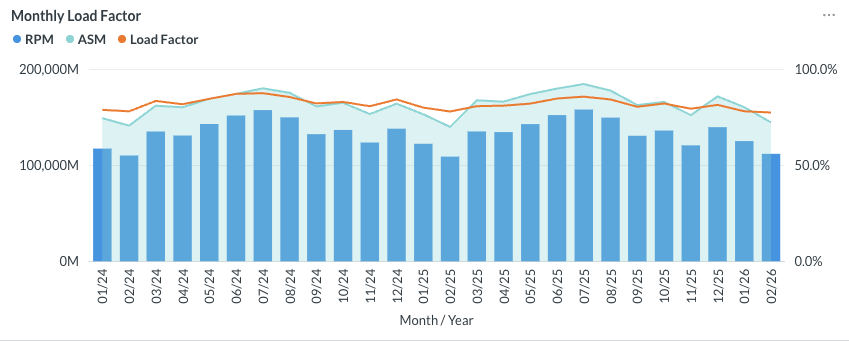
Figure 3: US Airlines’ Average Load Factor by Month
Month Over Month Comparison
All major U.S. airlines saw month-over-month gain in average daily domestic traffic in February 2026. JetBlue(B6), Allegiant (G4) and Frontier (F9) led the growth, with traffic increasing 15.4%, 15.0% and 15.0%, respectively, while Hawaiian(HA) and Alaska(AS) had the least growth.
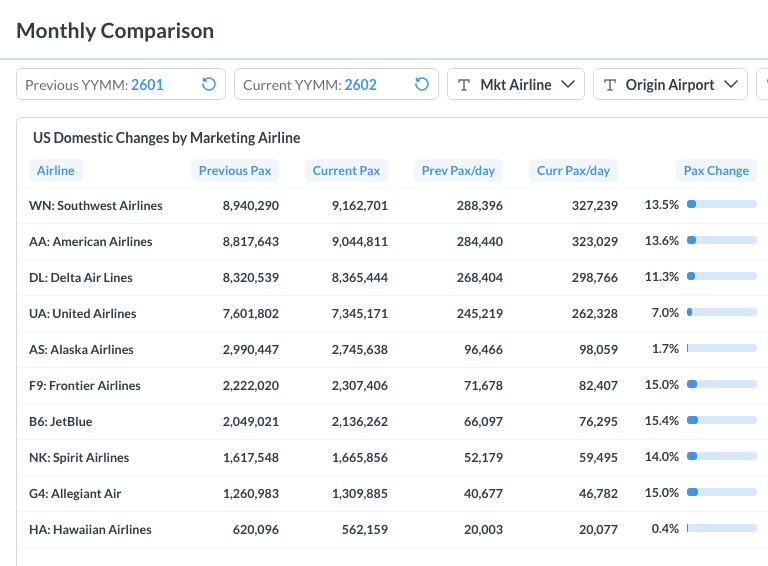
Figure 4: Domestic Air Traffic by Marketing Airlines in January 2026 (Previous) vs. February 2026 (Current)
Most U.S. airports reported passenger volume growth in February 2026. Boston (BOS), Chicago (ORD) and Las Vegas(LAS) each posted growth exceeding 20%. In contrast, Miami (MIA) and Fort Lauderdale (FLL) were the only major airports to record losses during the month.
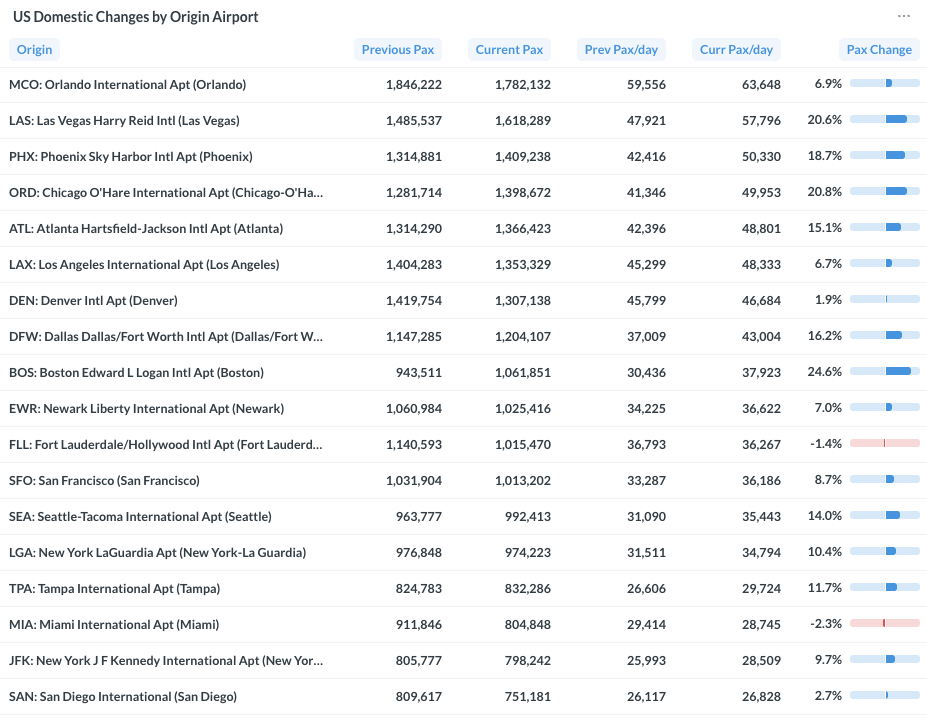
Figure 5: Domestic Air Traffic by Top Airports in January 2026 (Previous) vs. February 2026 (Current)
Year Over Year Comparison
From February 2025 to February 2026, most U.S. airlines recorded year-over-year growth. Alaska (AS) and Frontier (F9) led the industry with gains of 18.5% and 13.7%. In contrast, Spirit (NK) and Hawaiian (HA) experienced declines, with traffic down 23.1% and 7.0% compared with the same month last year.
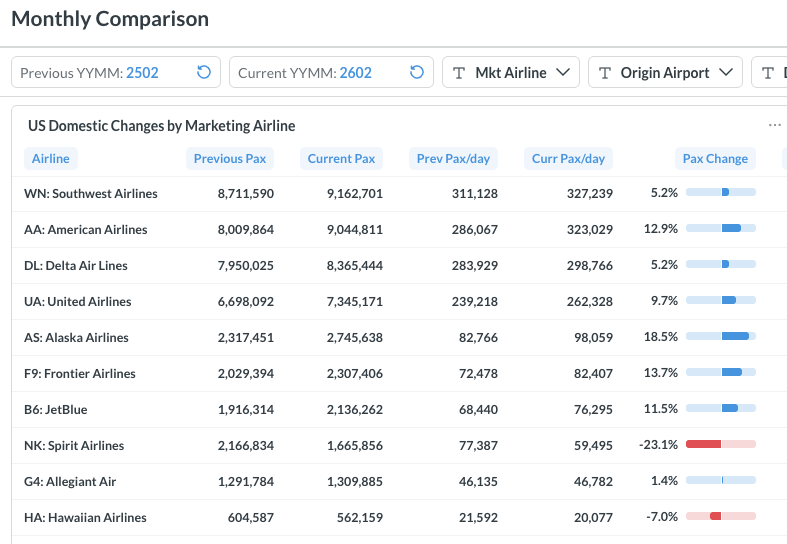
Figure 6: Domestic Air Traffic by Marketing Airlines in February 2026 (Current) vs. February 2025 (Previous)
From February 2025 to February 2026, all major U.S. airports recorded year-over-year increases in domestic traffic. Chicago O’Hare (ORD) and Dallas (DFW) led growth with 24.6% and 19.8% increase. Miami (MIA) and Denver (DEN) posted the least growth among large airports.
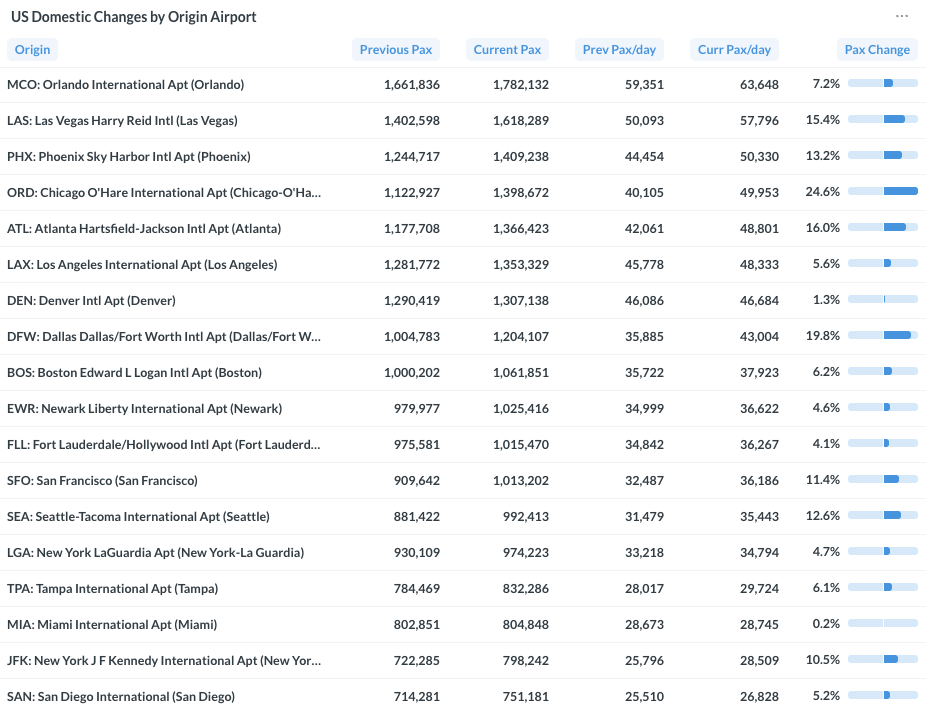
Figure 7: Domestic Air Traffic by Top Origin Airport in February 2026 (Current) vs. February 2025 (Previous)
For more detailed information on traffic and fares by route and airline, please contact service@flightbi.com or request a demo of Fligence USOD. They will be able to provide you with customized information to meet your specific needs and requirements.