Traffic and fare data by airline and route can provide valuable insights into market trends, demand, and competition. By analyzing this data, airlines can optimize their pricing strategies, plan their capacity, and make informed decisions about their route network. The data can also be used for market and competitive analysis, helping airlines identify profitable routes and gain a competitive advantage.
According to initial true O&D level data released this week by FlightBI, total U.S. domestic air travel decreased in November 2025. International travel volumes also declined during the same period, while average airfares were almost flat.
Volume Trend
In November 2025, U.S. domestic passenger traffic declined to 50.6 million, down from 54.5 million in October and only 1.2% higher than November 2024’s 50.0 million. International passenger volumes also decreased, dropping from 20.6 million in October to 19.4 million in November.
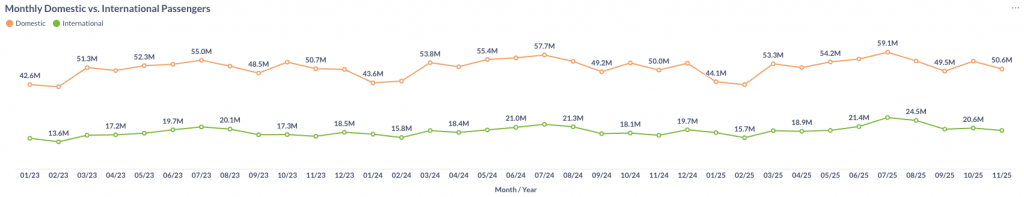
Figure 1: US Domestic and International Air Traffic by Month
Airfare Trend
Domestic airfares eased slightly in November 2025, as the average gross fare edged down from $221 in October to $220, and the average net fare fell from $189 to $188.
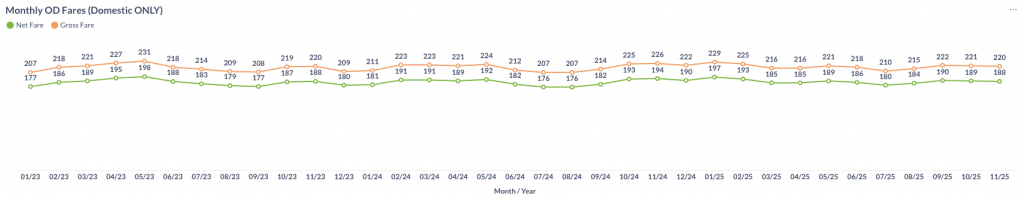
Figure 2: US Domestic Average Airfare by Month
Load Factor Trend
In November 2025, both Available Seat Miles (ASM) and Revenue Passenger Miles (RPM) decreased month over month. The average load factor for major U.S. airlines dropped to 79.5%, which is lower than the 80.7% recorded in November 2024 (see Figure 3).
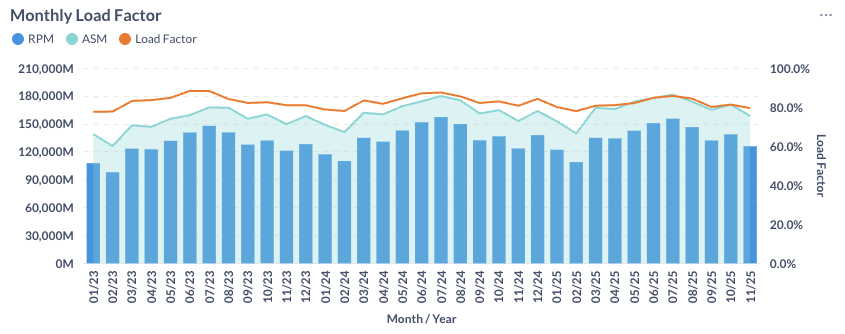
Figure 3: US Airlines’ Average Load Factor by Month
Month Over Month Comparison
In November 2025, most U.S. airlines recorded lower daily domestic traffic compared to October, driven by the seasonality and U.S. government shutdown. Spirit (NK) had a 14.7% decline, given its ongoing bankruptcy. However, JetBlue (B6) and Frontier (F9) managed growths, at 13.8% and 4.1%, respectively.
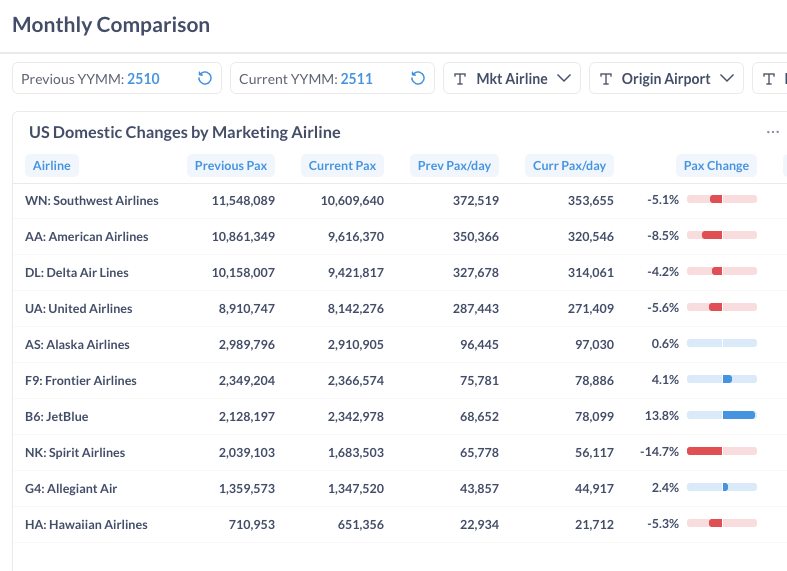
Figure 4: Domestic Air Traffic by Marketing Airlines in October 2025(Previous) vs. November 2025 (Current)
Most U.S. airports also reported passenger losses in November 2025. Chicago (ORD), Denver (DEN) and Boston (BOS) led the decline, with decreases of 14.6%, 11.4%, and 11.4%, respectively. On the other hand, Florida airports such as Fort Lauderdale (FLL) and Orlando (MCO) saw growths of 16.7% and 7.3%.
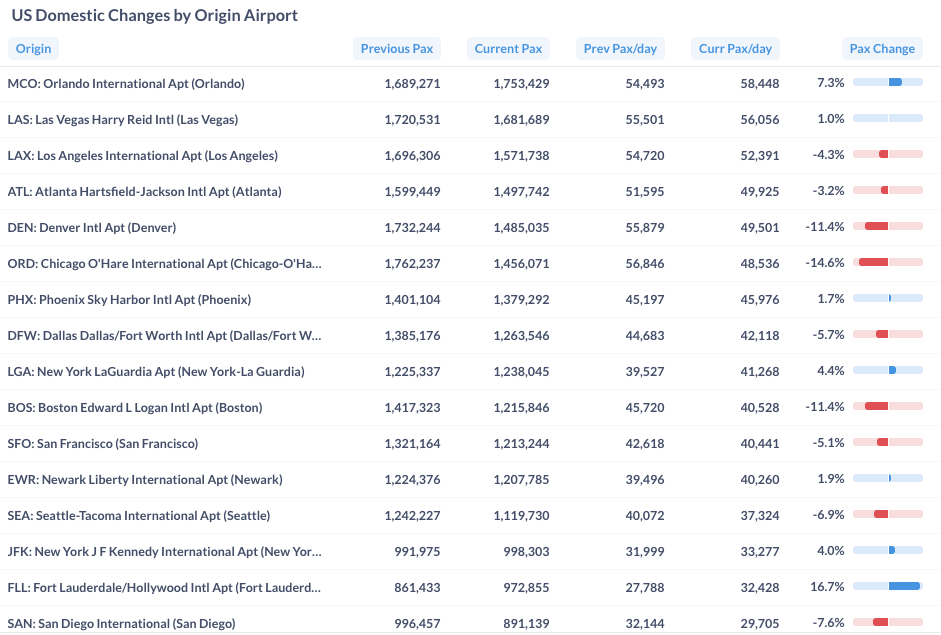
Figure 5: Domestic Air Traffic by Top Airports in October 2025 (Previous) vs. November 2025 (Current)
Year Over Year Comparison
From November 2024 to November 2025, most U.S. airlines posted year-over-year growth. Allegiant (G4) recorded a standout gain of 10.3%, followed by JetBlue (B6), United (UA) and Alaska (AS) at 7.5%, 5.2% and 4.1%, respectively. Frontier has a small decrease of 1.1%. The obvious declining carrier is Spirit (NK), down by 36.9% compared to the same month last year.
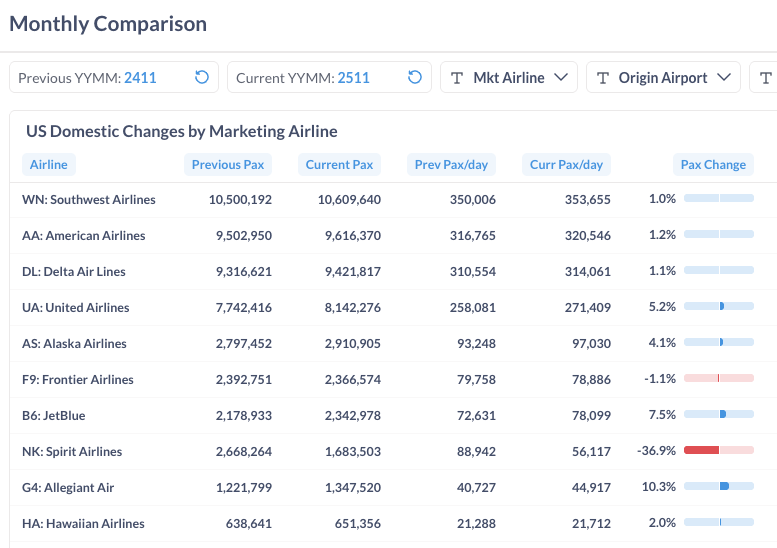
Figure 6: Domestic Air Traffic by Marketing Airlines in November 2025 (Current) vs. November 2024 (Previous)
From November 2024 to November 2025, more major U.S. airports experienced increases in domestic traffic than declines. Three New York airports (JFK, LGA & EWR) all have positive changes at 12.0%, 4.3% and 3.4%. In contrast, Los Angeles (LAX) saw a decrease of 6.3%.
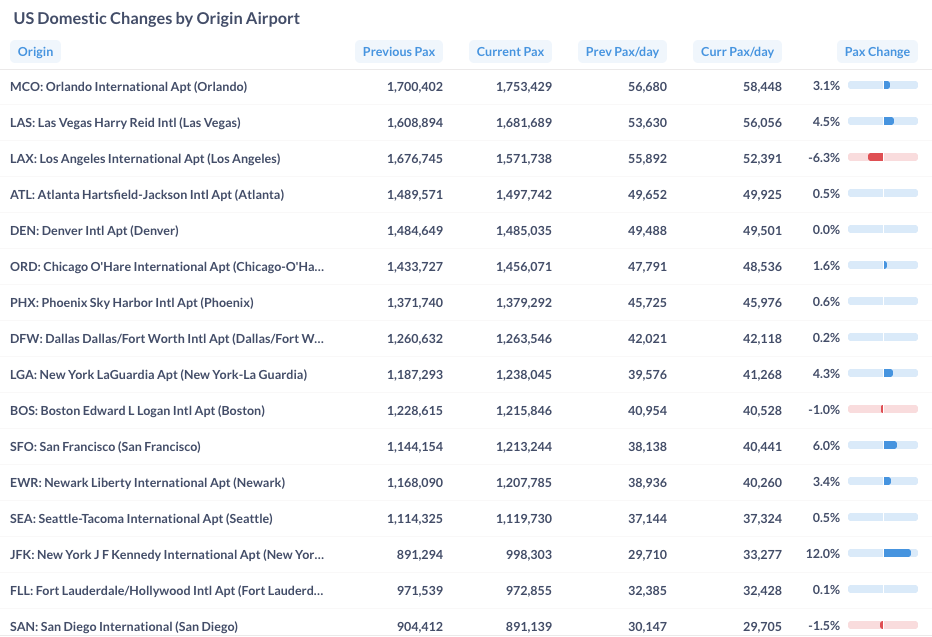
Figure 7: Domestic Air Traffic by Top Origin Airport in November 2025 (Current) vs. November 2024 (Previous)
For more detailed information on traffic and fares by route and airline, please contact service@flightbi.com or request a demo of Fligence USOD. They will be able to provide you with customized information to meet your specific needs and requirements.