Traffic and fare data by airline and route can provide valuable insights into market trends, demand, and competition. By analyzing this data, airlines can optimize their pricing strategies, plan their capacity, and make informed decisions about their route network. The data can also be used for market and competitive analysis, helping airlines identify profitable routes and gain a competitive advantage.
Based on initial true O&D level data from FlightBI released this week, total US domestic air travel saw an increase in July 2024 compared to the previous month. Similarly, US international air travel also experienced growth. Additionally, average airfares showed no change during this period.
Volume Trend
In July 2024, domestic passenger numbers increased from 57.2 million in June to 59.7 million, reflecting an 8.5% growth compared to July 2023, when 55.0 million passengers were recorded. Similarly, the international sector saw growth, with passenger numbers rising from 24.2 million in June to 25.6 million in July 2024.
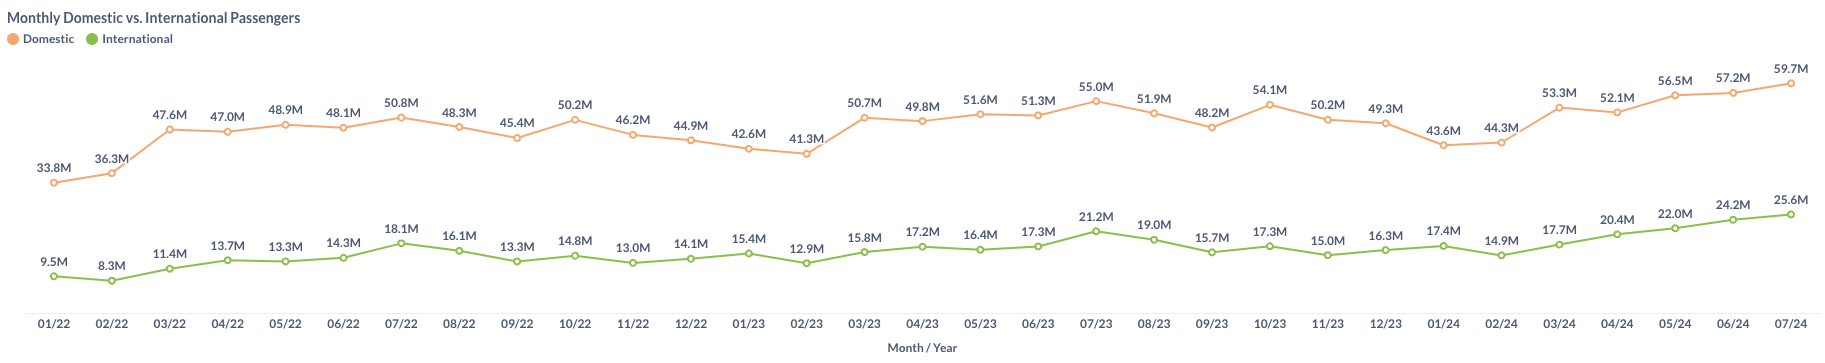
Figure 1: US Domestic and International Air Traffic by Month
Airfare Trend
Recent data shows a decline in airfare, even as the industry enters its summer peak. The average gross fare for flights dropped slightly from $228 in June to $227 in July. Similarly, the average net fare decreased from $195 to $194 during the same period.
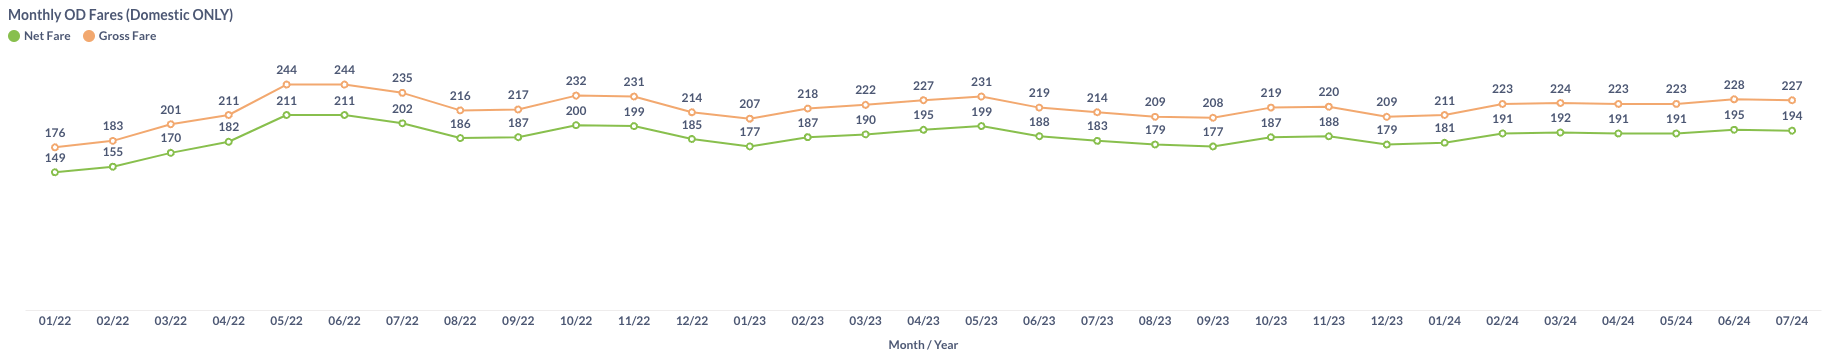
Figure 2: US Domestic Average Airfare by Month
Load Factor Trend
In July 2024, both Available Seat Miles (ASM) and Revenue Passenger Miles (RPM) increased compared to the previous month, while the average load factor remained largely unchanged at 86.2% for major U.S. airlines, as shown in Figure 3. However, this figure is still below the 88.2% recorded in July 2023.
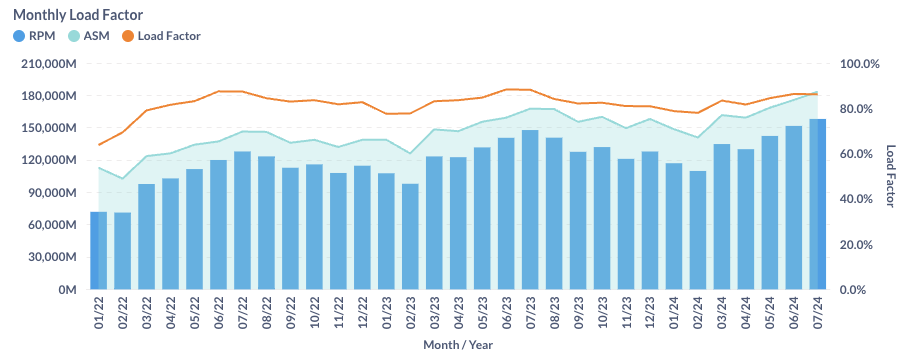
Figure 3: US Airlines’ Average Load Factor by Month
Month Over Month Comparison
In July 2024, all major U.S. airlines, except Delta (DL), experienced an increase in daily traffic compared to June 2024. Spirit Airlines (NK) notably led with a 9.6% growth. In contrast, Delta saw a 6.3% decline, attributed to its decision not to lower average fares.
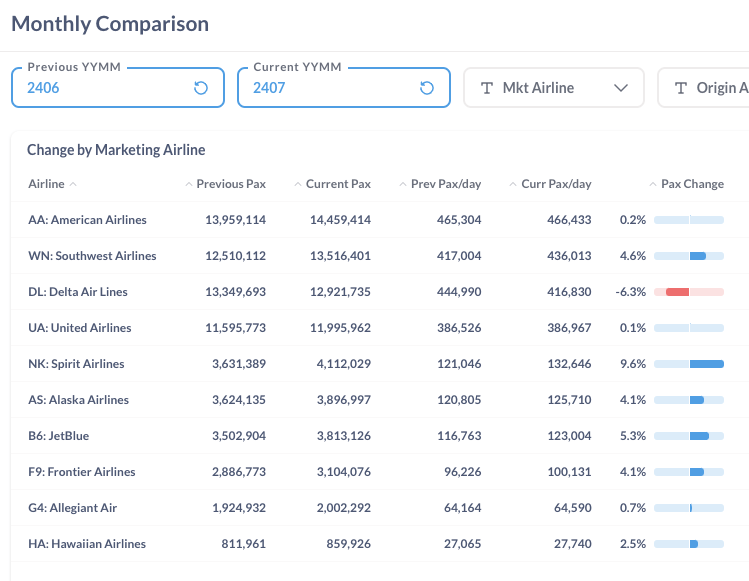
Figure 4: Air Traffic by Dominant Marketing Airlines in June 2024 (Previous) vs. July 2024 (Current)
During this period, traffic increased at some airports while declining at others. LaGuardia (LGA), Seattle (SEA), and Denver (DEN) led with month-to-month growth rates of 5.3%, 4.3%, and 2.7%, respectively. In contrast, Atlanta (ATL), Phoenix (PHX), and San Francisco (SFO) saw declines of 6.7%, 5.5%, and 2.0%, compared to the previous month.
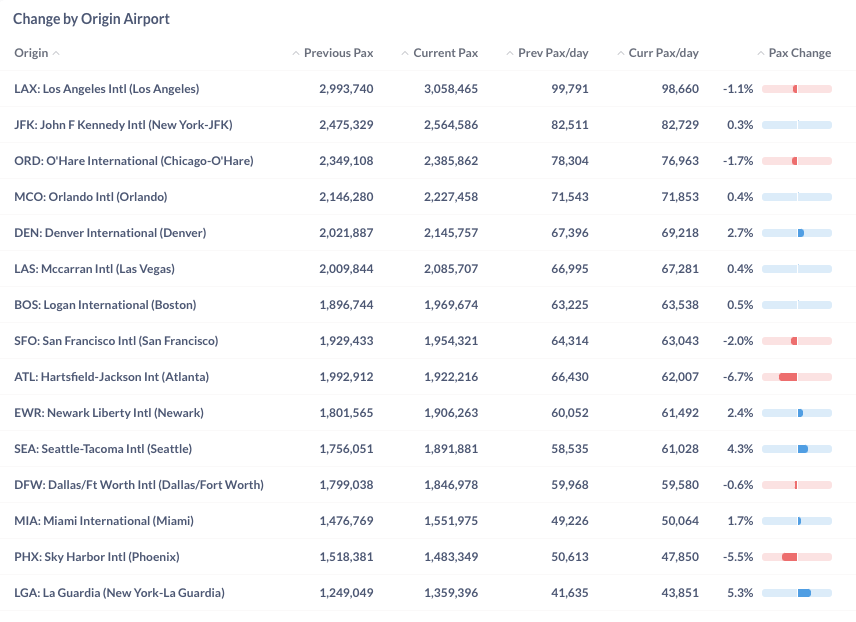
Figure 5: Air Traffic by Top Origin Airports in June 2024 (Previous) vs. July 2024 (Current)
Year Over Year Comparison
Between July 2023 and July 2024, all major U.S. airlines demonstrated growth. Low-cost carriers Frontier (F9) and Spirit (NK) led the trend, with growth rates of 28.9% and 18.9%, respectively. Among legacy carriers, American (AA) and United (UA) outpaced Delta (DL) in growth.
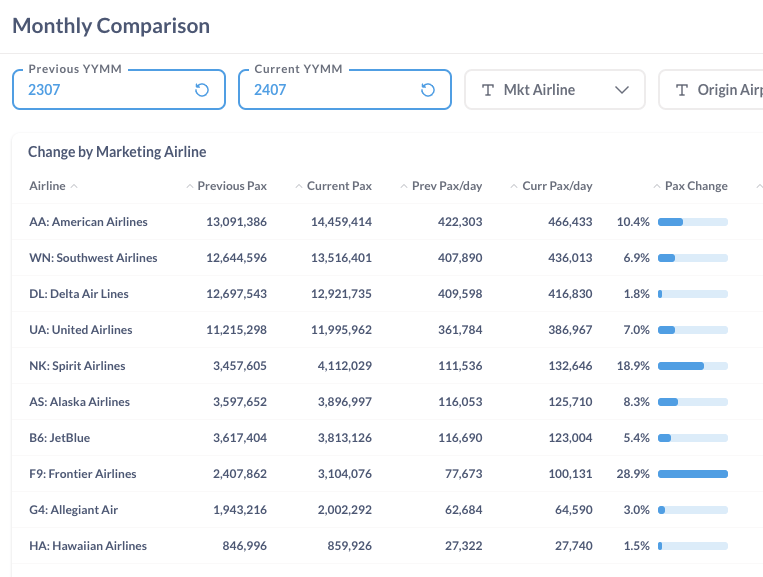
Figure 6: Air Traffic by Dominant Marketing Airlines in July 2024 (Current) vs. July 2023 (Previous)
From July 2023 to July 2024, all major airports saw increased traffic. New York JFK (JFK), Boston (BOS), and Miami (MIA) led this year-over-year growth, with significant expansions of 22.1%, 20.6%, and 17.3%, respectively.
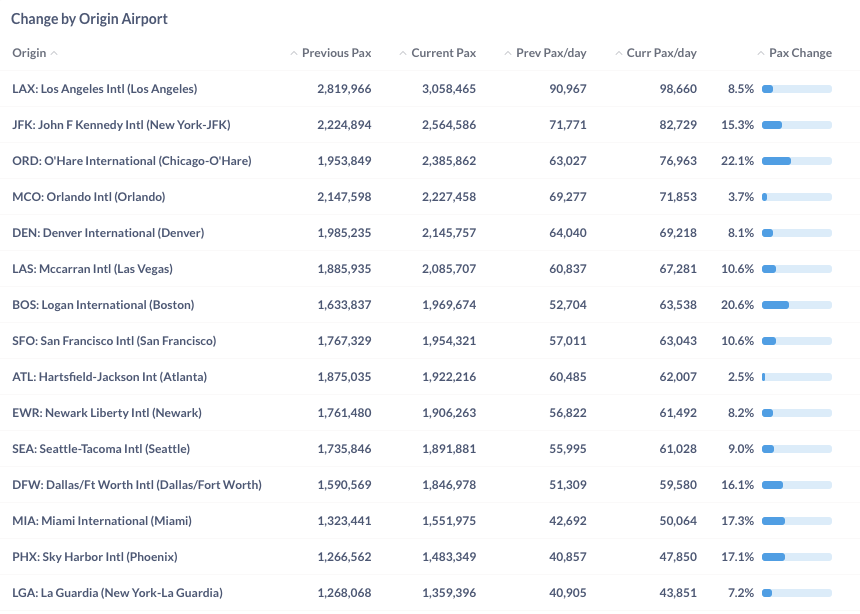
Figure 7: Air Traffic by Top Origin Airport in July 2024 (Current) vs. July 2023 (Previous)
For more detailed information on traffic and fares by route and airline, please contact service@flightbi.com or request a demo of Fligence USOD. They will be able to provide you with customized information to meet your specific needs and requirements.