Traffic and fare data by airline and route can provide valuable insights into market trends, demand, and competition. By analyzing this data, airlines can optimize their pricing strategies, plan their capacity, and make informed decisions about their route network. The data can also be used for market and competitive analysis, helping airlines identify profitable routes and gain a competitive advantage.
Based on initial true O&D level data from FlightBI released this week, total US domestic air travel declined in April 2024 compared to the previous month. US international air travel followed suit, with a similar decrease. Additionally, there was a slight reduction in average airfares during this period.
Volume Trend
In April 2024, domestic passenger numbers declined from 54.1 million in March to 52.8 million. However, this represents a 6.0% increase compared to April 2023, which saw 49.8 million passengers. Meanwhile, the international sector also experienced a slowdown, with passenger numbers decreasing from 21.4 million in March to 20.4 million in April 2024.
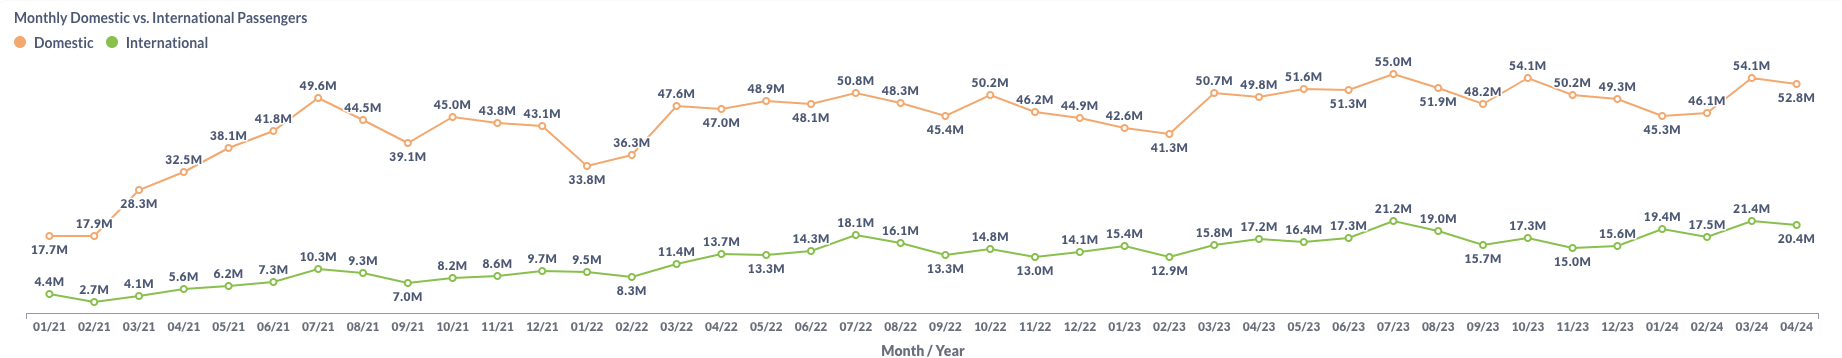
Figure 1: US Domestic and International Air Traffic by Month
Airfare Trend
The most recent data shows a slight decrease in airfare trends. The average gross fare for flights dropped from $213 in March to $210 in April. Similarly, the average net fare decreased from $183 to $180 during the same period.
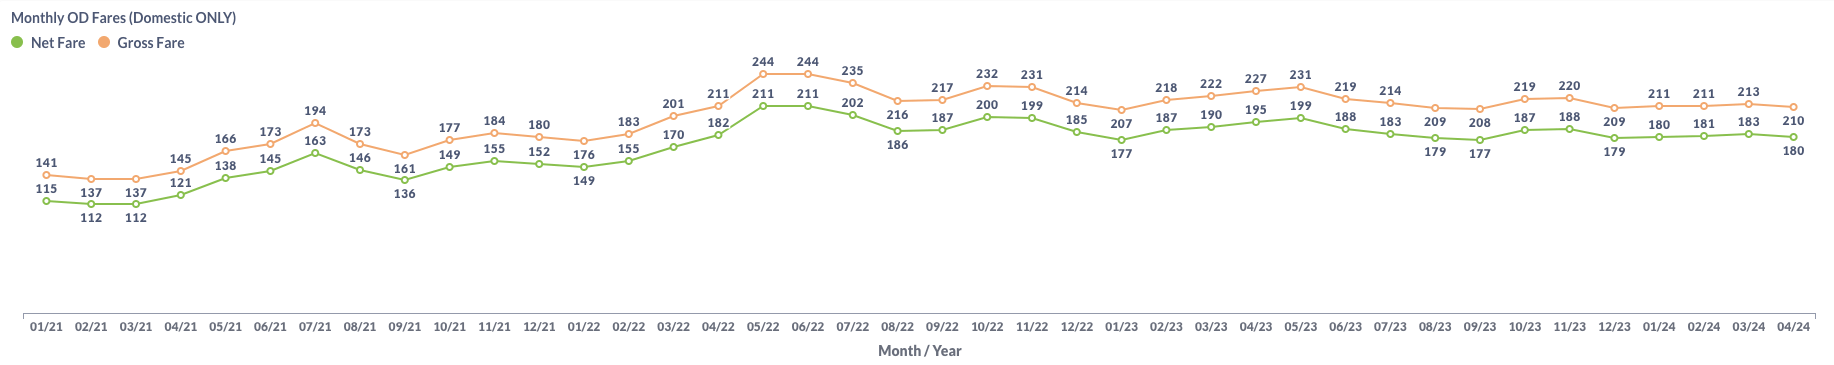
Figure 2: US Domestic Average Airfare by Month
Load Factor Trend
In April 2024, both Available Seat Miles (ASM) and Revenue Passenger Miles (RPM) saw a slight decrease compared to March 2024. This lead to a reduction in the average load factor for major US airlines, dropping from 81.8% in March to 80.6% in April, as illustrated in Figure 3. Additionally, this decrease places the average load factor below the 83.6% recorded in April 2023.
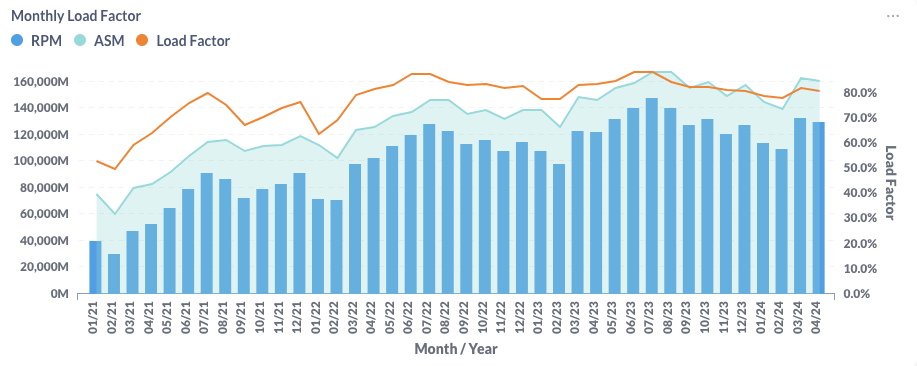
Figure 3: US Airlines’ Average Load Factor by Month
Month Over Month Comparison
In April 2024, half of the major US airlines experienced an increase in daily traffic compared to March 2024, while the other half saw a decline. Allegiant Air (G4) and Hawaiian Airlines (HA) notably led the decline, with decreases of 12.2% and 6.8%, respectively.
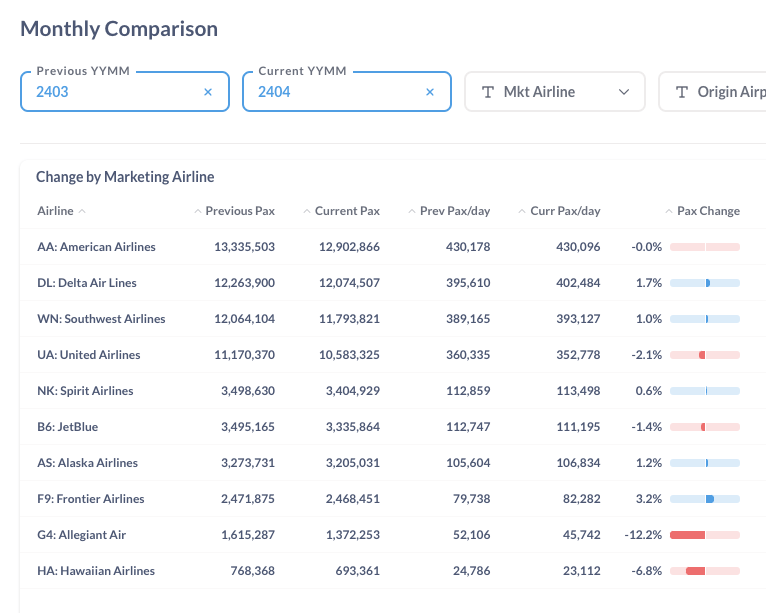
Figure 4: Air Traffic by Dominant Marketing Airlines in March 2024 (Previous) vs. April 2024 (Current)
During that timeframe, traffic at major airports presented a mixed picture. Boston (BOS) stood out with a month-to-month growth rate of 12.5%, while Ft Lauderdale (FLL) saw a 9.8% decrease from the previous month.
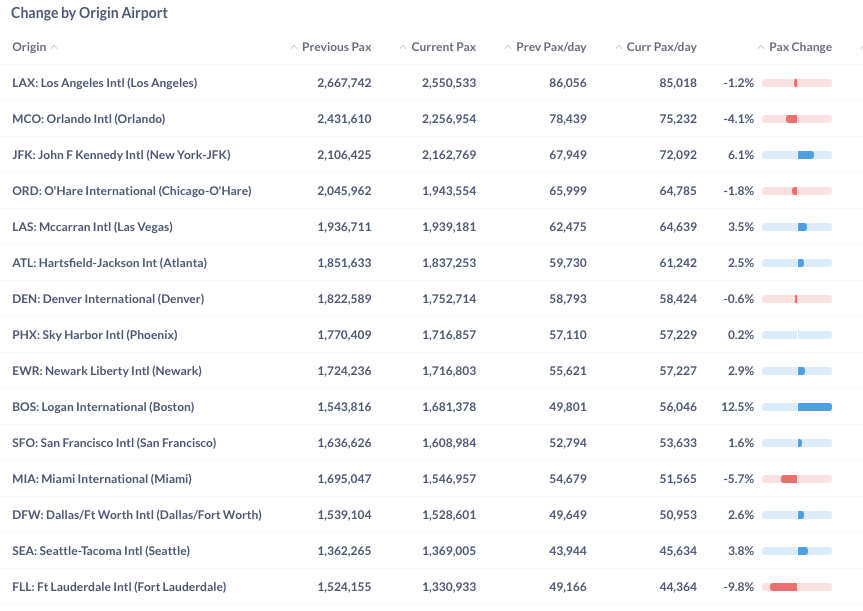
Figure 5: Air Traffic by Top Origin Airports in March 2024 (Previous) vs. April 2024 (Current)
Year Over Year Comparison
The year-over-year comparison from April 2023 to April 2024 shows growth among several major US airlines. Frontier (F9), American (AA) and Delta (DL) led the upward trend with growth rates of 14.8%, 8.1%, and 7.6%, respectively, highlighting their substantial contribution to the industry’s positive momentum. Conversely, Allegiant (G4) and Hawaiian Airlines (HA) recorded losses of 9.7% and 6.9%, respectively, compared to the previous year.
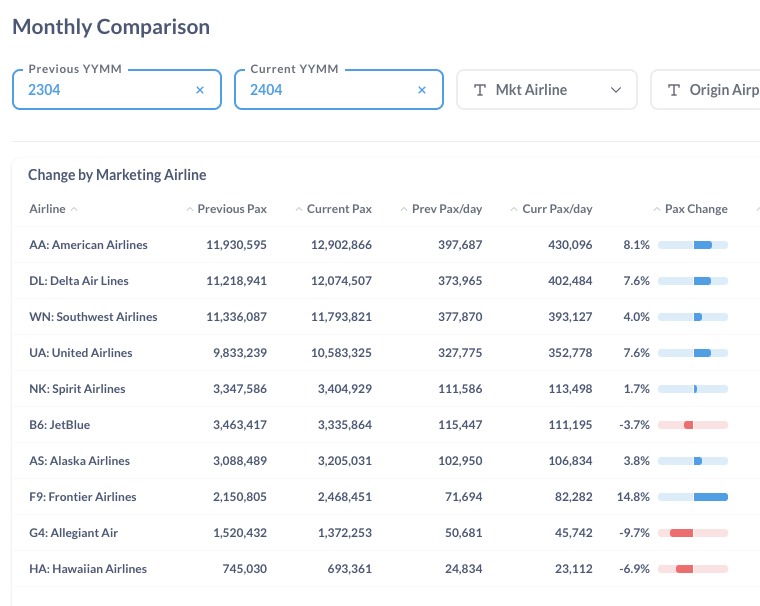
Figure 6: Air Traffic by Dominant Marketing Airlines in April 2024 (Current) vs. April 2023 (Previous)
From April 2023 to April 2024, most major airports experienced an increase in traffic. Miami (MIA), Chicago (ORD), and Dallas/Fort Worth (DFW) led this year-over-year growth, with significant expansions, recording traffic increases of 19.5%, 14.7%, and 14.1%, respectively. In contrast, Orlando (MCO) saw more moderate growth at a rate of 2.1%.
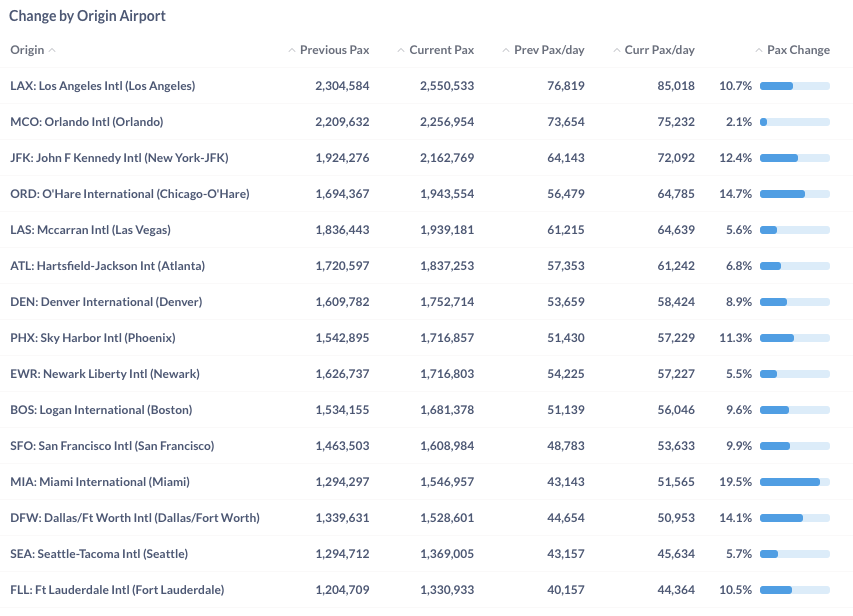
Figure 7: Air Traffic by Top Origin Airport in March 2024 (Current) vs. March 2023 (Previous)
For more detailed information on traffic and fares by route and airline, please contact service@flightbi.com or request a demo of Fligence USOD. They will be able to provide you with customized information to meet your specific needs and requirements.