✈️ January 2026 reminded us how volatile air travel demand can be.
Just three weeks apart, U.S. airport passenger volumes told two very different stories:
• Jan 4, 2026: 2,817,509 passengers screened
• Jan 25, 2026: 1,313,323 passengers screened
That’s a >50% swing in national throughput within the same month.
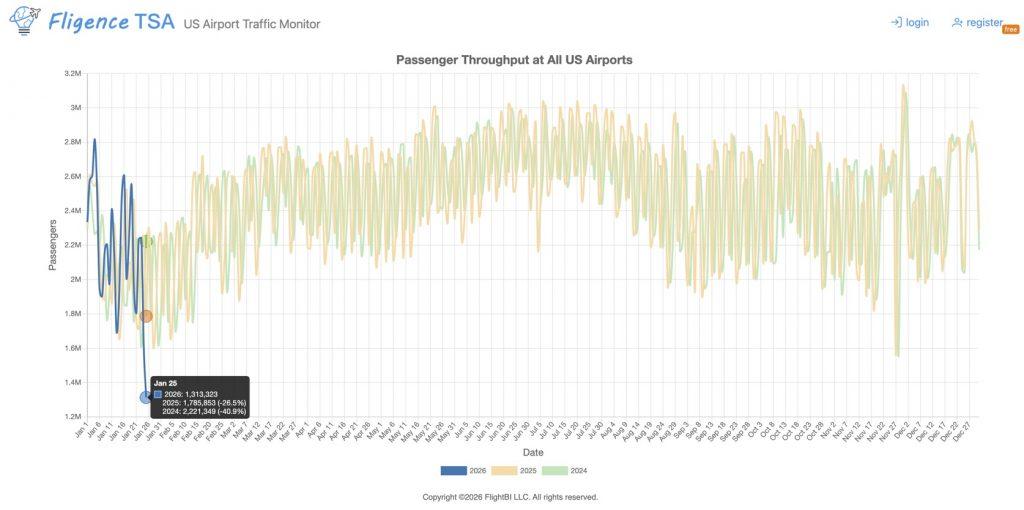
Winter weather events, post-holiday demand normalization, operational disruptions, and regional impacts all show up clearly when you look at the data by airport, by hour.
This level of volatility reinforces why real-time, granular visibility matters for:
- Airport operations & staffing
- Airline planning and recovery
- Ground transportation & concessions
- Policy and infrastructure decisions
📊 If you want to see where and when these swings happen—not just daily totals—you can monitor passenger volume by airport, by hour at tsa.fligence.com
Data doesn’t just explain the past.
It helps the industry prepare for the next disruption—before it hits.