In the increasingly competitive world of air service development, understanding where your passengers come from—and, just as crucially, where they leak to—is the foundation for smart route planning, marketing, and airport growth. The “catchment area” for an airport is not static; it’s a living, shifting landscape shaped by traveler preferences, competing airports, and local conditions. But how do you really know your airport’s true market reach and leakage? It all starts with choosing the right data.
Common Data Sources for Catchment Area Analysis
1. Passenger Surveys
Overview:
Surveys have long been a staple in the industry, typically asking passengers for their home ZIP codes at check-in, during Wi-Fi login, or via periodic outreach. Surveys can be customized and are familiar to most airport teams.
What They Offer:
- Relatively easy and low-cost to administer
- Insights into passenger motivations or demographics
Drawbacks:
- Participation rates are often low, and responses can be biased
- Data may quickly become outdated as travel patterns shift
- Only capture a subset of travelers, sometimes skewed toward leisure or certain demographics
Surveys are valuable for qualitative insights and benchmarking but have limitations for market share or leakage analysis.

2. Parked Vehicle Analysis
Overview:
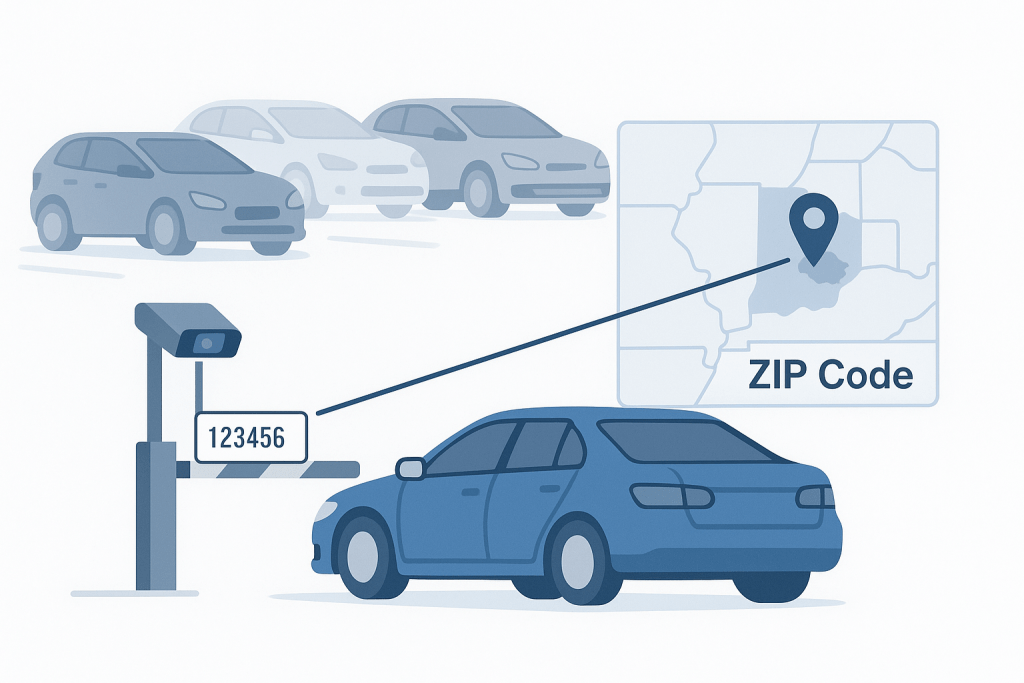
Analyzing license plate data from airport parking facilities and matching it to vehicle registration records is another established approach. It offers a direct look at where airport parkers are coming from.
What They Offer:
- Revealed behavior from travelers who drive and park
- Can provide fine-grained geographic details if registration data is accurate
Drawbacks:
- Excludes travelers dropped off, using transit, taxis, or ride-shares
- Vehicle registrations may not reflect current residence
- Doesn’t measure leakage to competitor airports
This method provides reliable information for certain passenger segments but lacks a complete market view.
3. Billing Data from Ticket Purchases
Overview:
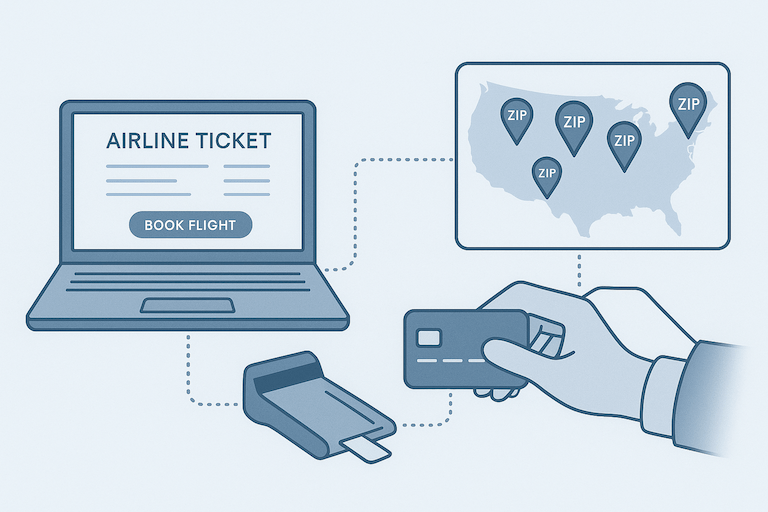
Using ticket transaction data from the Airline Reporting Corporation (ARC), MIDT, or airlines themselves, airports can map passenger origins based on billing address.
What They Offer:
- Large sample size
- Industry-standard, often used for competitive benchmarking
Drawbacks:
- Data often lags, and privacy agreements may limit granularity
- Billing addresses of corporate travelers may be their headquarters’ office address, not the traveler’s home
- Gaps for some carriers or channels (e.g., Low-Cost Carriers who don’t use ARC’s settlement services and don’t participate in the GDS systems, or direct bookings of legacy airlines)
Billing data remains an industry fixture but often requires careful interpretation, especially for leakage or market share questions.
4. IP Address Tracking in Travel Search Data
Overview:
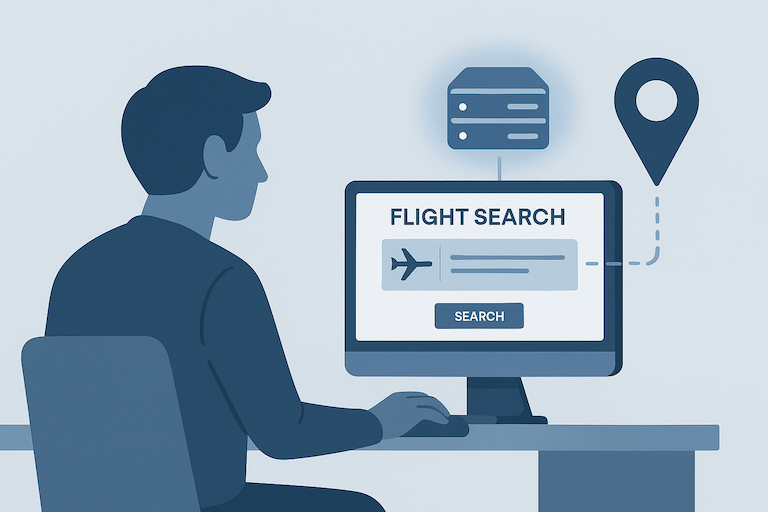
Some analytics providers use IP addresses from online travel searches to infer passenger location and interest in routes.
What They Offer:
- Potential for high search volumes and real-time signals
- Useful for digital marketing targeting
Drawbacks:
- Search activity does not equal actual trips. Travelers living in rural area often conduct more searches per trip than those living in major metropolitan areas (Read the full white paper here).
- IP addresses frequently reflect the location of the ISP, not the actual traveler
- Widespread VPN use, mobile browsing, and ISP routing can place users miles from their true home
- Risk of misinterpreting demand and overestimating catchment in areas with clustered ISPs
While tempting as a source of digital demand signals, IP tracking is unreliable for serious catchment or O&D work. If traffic is allocated based on search volume, the search behavior difference can introduce large bias toward rural areas and lead to overrepresentation of those areas in traffic figure attributed to major airports.
5. User-Generated Content (UGC) & Social Media
Overview:
Mining social media geotags and travel posts offers creative possibilities but introduces significant bias.
What They Offer:
- Real-time, public content
- Can sometimes reveal qualitative trends or group travel patterns
Drawbacks:
- Heavy participation bias
- Sparse data for most airports
- Lacks quantitative robustness for strategic planning
Social media can help spot trends but can’t support high-stakes market analysis.

6. Mobile Location (Air Mobility) Data
Overview:
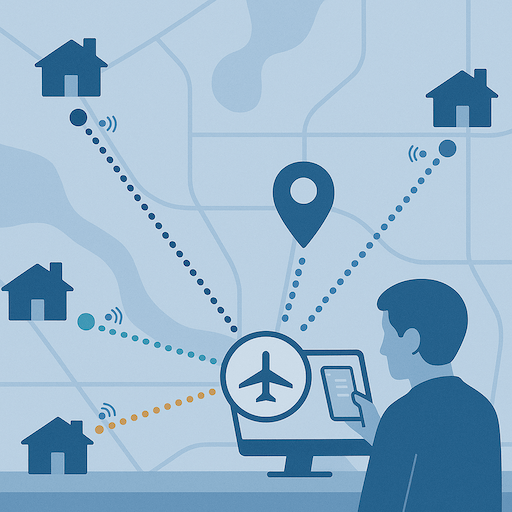
The latest advancement is the use of anonymized, permissioned mobile device data—what’s often called “air mobility data.” This approach tracks real, aggregated movement patterns, capturing how people actually travel to, from, and around airports.
What It Offers:
- Direct measurement of passenger origins and travel patterns
- Reflects all access modes—driving, drop-off, transit, ride-share
- Enables comparison with competing airports for precise leakage analysis
- Updated regularly, providing near real-time insights
- Allows segmentation of residents and visitors
Limitations:
- Air mobility data licensing is expensive
- For smaller airports, sample sizes may need careful interpretation
- Analysis should be handled with expertise in geospatial analytics
Air mobility data represents a shift from modeling and inference to direct observation—providing a level of accuracy, scope, and freshness not possible with legacy methods.
In Summary
Each of these data sources contributes to the evolving field of airport catchment analysis, and many airports find value in layering multiple sources for cross-validation. However, as traveler behaviors and market dynamics become more complex, the need for integrated, high-resolution insights has never been greater.
Looking Ahead: Integrated Approaches for Airport Market Analysis
Today, the most effective catchment and leakage studies often combine multiple data streams—pairing air mobility data with sources like ticketing or segment-level data to create a comprehensive, actionable picture of passenger flows and preferences. As new tools and platforms become available, airport teams can benefit from solutions that deliver detailed origin-destination information, user-friendly dashboards, and powerful analytics for strategic planning.
Solutions such as FlightBI’s ZIP-OD platform reflect this direction, blending multiple data sources—including air mobility data, airline ticketing data, and segment onboard data—to provide a unique, ZIP code-to-destination view by airline. With modern visualization and AI-powered analytics, these platforms are making it easier for airports to identify trends, understand market share, and address traffic leakage with confidence.
As the air service landscape continues to evolve, adopting integrated, user-friendly data tools can help airport professionals stay ahead—supporting smarter decisions and long-term growth.
Interested in how integrated data can strengthen your airport’s strategy? The FlightBI team is always available to share industry insights and discuss best practices for catchment analysis in today’s environment.
